With support from GridLab we were able to integrate an initial draft of the FERC Electric Quarterly Reports (EQR) into PUDL! EQR has been at the top of our data wishlist for almost half a decade and we’re excited to publish this first draft for beta testing.
What’s in EQR?
We’ve heard from PUDL users that efforts to design cost-effective decarbonization pathways are hindered by limited visibility into the financial flows and market structures that shape the electricity sector. EQR offers an enormous amount of data describing transaction-level data on prices, quantities, and contractual terms between power producers, utilities and financial intermediaries. Yet the dataset remains largely underutilized due to accessibility and quality barriers.
In its raw form, it is published by FERC as hundreds of gigabytes of nested zip files with little documentation, so querying and analyzing EQR data requires both domain knowledge and some data engineering skills. We hope that our minimally transformed version of EQR in PUDL will reduce barriers to access and get the data into the hands of the people that need it.
The EQR data records U.S. electricity wholesale market activity in great detail–sellers report transactions and their contractual terms on timescales ranging from 5-minutes in real-time spot markets, up to multi-year power purchase agreements (PPAs). With thousands of market participants and dozens of electricity products, the EQR contains billions of records.
EQR data is organized into three main tables: identifying sellers, describing contracts, and enumerating transactions. The seller identity table provides a unique FERC company ID that is used across multiple FERC Forms and associates that ID with the company name. The contracts table records 30 attributes of contracts that were active during the quarter, and whether or not any transactions took place under them. The transactions table contains 26 fields including the unit price, quantity and electricity product being sold.
Data Access
Tutorial Video and Python Notebook
Here’s a tutorial video showing how to access data and what you can expect to see in the data. In the video, we walk through this Python based interactive notebook which demonstrates how to access and work with the EQR data, including a toy analysis of the contracts and transactions tables.
You can browse the data through our PUDL Data Viewer UI and download small subsets of the data.
Parquet Files from Cloud Storage
We publish Apache Parquet files of all EQR data released between 2013 and present to publicly accessible cloud storage. The files are partitioned by quarter. These will be automatically updated quarterly by the 15th of Feburary, May, August and November. You can find the data in S3 under this path:
s3://pudl.catalyst.coop/ferceqr
Each table has its own subdirectory, containing quarterly parquet files:
See here for more information on accessing PUDL data from cloud storage.
Feedback
There’s a bunch of additional data cleaning work that we’d like to take on if we can secure additional funding for the project. This includes tasks like cleaning and standardization of categorical data, finding and fixing invalid dates, and dealing with duplicate values.
We’d love to get some feedback from real users, hear about your use case, and figure out what issues you may have run into. You can reach out to us at [email protected], or if you run into any problems, please feel free to create an issue on GitHub. You can find the issues we’re already tracking here:
2025 was the first year of the PUDL Sustainers Program. We designed the program to ensure the ongoing impact and reliability of PUDL: data and software are kept up to date, bugs are fixed, and everything gets tested and released on a regular schedule. At the same time, we sought to foster closer relationships with the organizations that rely heavily on PUDL data for their work, giving them an opportunity to see under the hood and weigh in on important decisions.
Thanks to support from our inaugural sustainers, RMI and GridLab, we were able to launch the program and keep PUDL up and running!
24,000 unique IPs Accessing PUDL data from cloud storage buckets
The Federal Energy Regulatory Commission (FERC) collects a lot of data in its role as the regulator of US electricity markets. One dataset that we’ve had our eyes on for years, but never had the resources to integrate into PUDL (until now!) is the Electric Quarterly Report or EQR.
The EQR is the reporting mechanism FERC uses for public utilities to fulfill their responsibility under section 205(c) of the Federal Power Act (FPA) to have their rates and charges on file in a convenient form and place.
Under this section of the FPA:
Where two or more public utilities are parties to the same rate schedule or tariff, each public utility transmitting or selling electric energy subject to the jurisdiction of this Commission shall post and file such rate schedule
In modern US electricity markets, there’s more than a million of these transactions every day. This makes posting them in a “convenient form and place” non-trivial. FERC provides an online EQR report viewer where you can scroll through a list of thousands of sellers and download their filing for a particular quarter as a summary PDF. But this is no way to do analysis.
They also offer bulk downloads of the raw data as quarterly zipfiles containing CSVs or XML documents, but with more than 4 billion transactions recorded since the modern reporting era started in 2013, these formats are also not very ergonomic for bulk analysis. And even as compressed zipfiles, the full FERC EQR dataset is 100 GB. It’s far too big analyze in bulk locally with tools like pandas, let alone spreadsheets. However, with the development of tools like DuckDB and Polars over the last few years, working with this scale of tabular data has become much easier — even on a laptop!
The data locked up in the FERC EQR is potentially valuable for understanding how renewable energy power purchase agreements and battery storage prices have evolved over time, and what’s really driving rising energy costs. The EQR data is particularly valuable for less organized markets like the US Southeast and Intermountain West, where there is no ISO/RTO market data. We’re hopeful that this data can also make it easier to programmatically identify anti-competitive utility affiliate transactions and uneconomic self-dispatch by regulated monopolies.
Democratizing FERC EQR Access
With additional support from Gigawatt-tier PUDL SustainerGridLab, Catalyst is going to create an open access, cloud-native version of the FERC EQR dataset, designed for bulk analysis.
Timeframe: We expect to be working on the project from now through the first quarter of 2026.
Data Coverage: We are initially targeting the 2013Q3 to present data, since it is all in a very similar format, while older EQR data was submitted under a different reporting regime, in a different format, and is also not as rich in detail (though we have already archived the raw 2002-2013 data).
Outputs: We’re planning to mirror the structure of the current data, with four main tables: transactions, contracts, filer identities, and index publications, along with a new table that records all FERC company IDs and tracks how their reported name and other attributes change over time.
Format: The data will be distributed as a collection of Apache Parquet files, probably partitioned by quarter. All of the data from 2013Q3 to the present will use the same well-defined schema, informed by all of the historical EQR data dictionaries published by FERC.
Processing: Our first priority is making the bulk data freely accessible in a format that’s appropriate for analysis. We are not planning on doing any major data processing, beyond enforcing a uniform schema, converting the data to Parquet, and dealing with character encoding and CSV formatting issues that affect ~1% of all records.
Versioning: Due to the size of the data and the limited free cloud storage we have as part of the AWS Open Data Registry we won’t be able to provide multiple historical versions of the outputs like we do with other PUDL data. Whenever we update the outputs, the older version will be replaced.
Updates: We plan to update the outputs at least once a quarter, and will capture fresh snapshots of the raw EQR data using our automated data archiving scripts.
Access: We plan to publish the FERC EQR alongside the rest of our PUDL data in a freely accessible S3 bucket as part of the AWS Open Data Registry. We also intend to make the EQR outputs available for preview and querying through the PUDL Data Viewer, which will allow users to download smaller subsets of the data as CSVs for spreadsheet-based analysis if that’s what they need.
Get Involved!
If you’re already familiar with the FERC EQR and want to help test out the new data we’d love to hear from you: [email protected]
We’d like to better understand how this data is used in any context, whether it’s research, policy, journalistic, or commercial, so if you’ve got a use case in mind for historical electricity transaction data, let us know what it is. Maybe sign up for office hours so we can chat more, or help you get familiar with Parquet files.
What other data does the FERC EQR need be connected to? One of the things we’re hoping this analysis-ready, cloud-native version of EQR will enable is robust record linkage with other datasets. Can we identify the LMP nodes where power is being delivered? Can we identify electricity buyers in other FERC or EIA data, even though all we have is their name? What else should we be thinking about?
Stay up to date with the project: Subscribe to our ~monthly newsletter, keep track of the FERC EQR issues in the main PUDL repo, or follow the EQR scoping repo where we’ll be prototyping the new system.
After 5 years of ogling the EQR from afar, and projecting our (data) hopes and dreams into its depths, we’re excited to finally tackle it for real, and hope it’ll be a valuable resource for understanding US energy markets and accelerating the ever more economical decarbonization of the US electricity system.
Last July we conducted more than 60 interviews with energy data users to kick-off our work for the NSF POSE grant! While that process was very informative, it was also a huge amount of work, and we also want to have more sustainable ways to understand the needs of energy data users (PUDL or otherwise).
So this winter, we put out our first annual Energy Data Ecosystem Survey—a short, mostly multiple-choice questionnaire built on insights from our conversations. 47 of you responded, and we learned a lot!
Before we dig into the results, we’ve made a few other changes in the wake of talking to you all:
One of our core takeaways from the interviews was how organizations struggle with technical skill building and capacity. This is something Catalyst can address with our consulting services and educational content creation. Thanks to funding from the Sloan Foundation, we’ve developed OpenEnergyData4All, a training series to help future and current energy data users gain more confidence in their technical skills. We’re excited to continue creating content like this to help people engage more readily with the data!
Another important theme was users’ desire for data that is easy to explore. A large portion of technical and non technical users relied heavily on our PUDL browser viewing tool, Datasette. While Datasette was simple for us to set up and enabled users to explore PUDL data on the web and download CSV’s, it isn’t really designed to handle the scale of data that we’re publishing now. We developed a Beta PUDL Viewer for technical and non technical users to interact with and search through the data with greater ease. We’re continuing to improve the tool, so be sure to leave any feedback or ideas here.
Now, the Ecosystem Survey. The TL;DR:
It’s difficult to find the right data to answer your questions, and PUDL is no exception. We need to make it easier for folks to find what they’re looking for and parse through our extensive data catalog. We’re excited about the new PUDL data viewer, but there’s more we can do to make PUDL more useful and less overwhelming.
We did a good job picking the most important datasets to pull into PUDL! Generally speaking the data that are used most often are the ones we’ve integrated (pats self on the back), though there was undoubtedly some bias in who took the survey.
Energy data users have more Python and open source contribution experience than we thought! This combined with the fact that most energy data users have at some point written down quirks about the data tells us that we need to make contributing to PUDL easier and more desirable.
Now here’s a deeper dive on the state of energy data according to you:
Who are you?
You’re mostly academics and educators, but you represent a wide range of organization types including NGOs, for-profits, and hobbyists. A smaller subset of you represent folks working directly in policy, utility regulation, or for utilities themselves. Notably, none of you are journalists.
The primary outputs of your work are peer reviewed publications, data visualizations, and reports.
This is not entirely surprising as most of the grants we’ve received prioritize building better teaching and research tools for the academic community. Many of our datasets also contain long, historic time series which cater more to academic research than something like real-time market data might to the private sector. We’re excited to continue serving these communities and hope to engage more readily with university labs moving forward. If that’s you, let’s get in touch!
Knowing that researchers make up the bulk of energy data users also helps us prioritize things like clear methodologies that we know are important to them.
Utilities rank low likely because they use their own data and don’t rely as much on public or commercial sources of information. National Labs, on the other hand, are definitely using energy data–their lower ranking might be an artifact of our network or outreach strategy.
All org types in the bottom half of the ranking are ones whose data use we want to better understand.
What are you using energy data for?
You primarily use this data for utility or facility level financial and economic modeling, but you’re also quite involved in developing new policy proposals, energy system models, regulatory interventions, and spreading awareness about the climate and its impact on the grid.
It makes sense that the primary use for energy data is modeling. Luckily we already sniffed this one out and are working closely with GridLab to make our outputs as model-ready as possible. We’re considering things like making a set of standard inputs for the most common models and removing any usage barriers that modelers have with PUDL. If you’re a modeler with ideas about how to make PUDL data better, reach out!
While policymakers may not be the ones using the data, the data is affecting policy in the venues that count! We are interested in understanding the full diversity of uses for this data, so whether you think you are doing something groundbreaking, niche, or utterly everyday, write and tell us about it! We want to know the full data-to-impact story.
What data are you using the most?
The most sought after datasets tend to be those already integrated into PUDL: EIA 860, EIA 923, EIA 861, NREL ATB, and FERC Form 1. Many of you also rely on data that is not yet (fully) integrated into PUDL: Weather data, EIA AEO, NREL EFS, NREL ResStock, ISO/RTO data, Census, and EPA eGrid data.
Our survey included many PUDL users, so it’s not shocking that the datasets they value most are already available in PUDL. Still, it’s encouraging to see respondents’ priorities align with our core offerings. This suggests that we’ve chosen high-impact datasets and can focus more time and energy on improving them.
Identifying which non-PUDL datasets matter is equally important. It helps us prioritize future integration efforts and make a stronger case for funding them. Some of these datasets are already archived on our Zenodo and would be relatively straightforward to incorporate (e.g., EIA AEO, eGRID, NREL EFS). Others are more complex. Here’s how we’re thinking about the trickier ones:
Generally speaking, weather data from sources like NOAA, NASA, and NWS is a lot cleaner and more readily accessible than some of the other data we work with, so the need for a clean copy is less urgent. It’s also much larger and typically structured as a gridded multi-dimensional array, rather than a database table, making it more complicated to integrate into PUDL. Moreover, weather data is a bit outside our purview–we’re not as confident cleaning, transforming, and explaining it as we are energy system data.
It might make sense for us to collaborate with modelers or an organization with domain expertise to help build a bridge between big weather data and energy system model inputs. However, there’s been a fair amount of research in this vein, and gaps or granularity issues in the underlying data seem to be more of a barrier than data access itself. Check out atlite and renewables.ninja for relevant work.
ISO/RTO data is not a product of the federal government, so it’s subject to a set of unique licensing and usage constraints that we’d have to examine more closely before republishing. Extracting and synchronizing data from RTO/ISOs is also non-trivial given the real-time nature of the data and the fact that each ISO/RTO is an independent organization that handles data differently. Grid Status has this covered.
NREL ResStock is interesting but for now too large to archive on Zenodo.
If you’re using any of these non-PUDL datasets, let us know how we could help make them more accessible. What sort of format or tables are most useful to you?
How do you choose and obtain data?
72% of you access data by downloading it directly from federal and state agencies. Unsurprisingly (it’s our survey after all) 60% of you are PUDL users too. A smaller, but not insubstantial portion (33%) of you endeavor to get data directly from utilities and/or the various RTOs/ISOs.
When choosing a dataset, 72% of you also indicated that clear data processing methodology is important. Other considerations include data sharability, format, and update cadence. These factors were cited more frequently than things like data resolution or completeness.
The big takeaway here is that users are more likely to get data straight from the source than curated, often costly platforms like S&P, Hitachi, or Yes Energy, even if that means doing a little (or a lot) of cleaning themselves. We can harness all this knowledge by giving people more opportunities to share their experiences working with these raw datasets and incorporating that information into PUDL.
This also serves as an important reminder that just because our code is open source does not mean that our methodologies are clear and transparent. In order to build trust with users, we need to make sure that PUDL does an adequate job of explaining how the data are processed. This is something we care deeply about and have discussed at length. There are many different ways to share data transformation methodologies, and we want to make sure our approach is both intelligible and readily maintained. This topic could be a whole new blog (and hopefully will be eventually). For right now, we’re aiming to bolster our documentation so it’s easier to navigate and understand what is going on!
How do you work with data?
The majority of you rely heavily on Python (81%) to process your data. Excel and R are tied, followed by SQL and others.
CSV, Parquet, and JSON are your most desired data formats, in that order. PDF and XML/XBRL shared a spot at the bottom with 0 votes.
Most of you have written down quirks about the data you are working with or made visualizations to accompany your work with PUDL data. As noted above, a decent chunk of you have also had to contend with data not yet available through PUDL, thus extracting and transforming it on your own. Very few folks have tried to incorporate this work into PUDL. However, nearly half of you have experience creating GitHub issues or even writing pull requests to change source code.
This further confirms our desire to improve the PUDL contribution process! We want to provide people with venues to share their knowledge about the data, not just write code. Our current idea is to build an energy data wiki that anyone could contribute to. This would help lower the barrier to entry for compiling qualitative information about the data.
What are your pain points when using energy data?
Nearly half of you struggle to find the right data to answer your questions, extract data from difficult formats (like PDFs), and connect data from disparate datasets with no common identifiers.
With regard to PUDL specifically, you aptly noted that we publish multiple versions of the same data without enough documentation to let users identify which version is right for their use case. For the amount of information in PUDL, you also noted that our docs are confusing and sometimes insufficient.
What we’re hearing is that people are more concerned with accessing the data than the quality of the data itself. This makes sense! If you can’t use it, who cares how clean it is. We know how you feel. In fact, we built a whole company around it… It also tells us that we should focus on integrating datasets that are particularly difficult to access in their raw published state–like those stuck in PDF format or with major record linking challenges. These datasets present a greater logistical challenge but result in greater positive impact for users.
It also sounds like we need to spend some time helping people navigate different available datasets, starting with those in PUDL, and perhaps extending to the vast array of data available elsewhere. It’s time for us to knuckle down and spiff up our documentation!
What are we going to do about it?
After reading everyone’s responses and processing the information we collected from the 60 informational interviews, we came up with a list of projects that would improve both PUDL and people’s experience working with energy data in general. The core takeaway is a need for more and better documentation. We’re going to make a concerted effort to put ourselves in your shoes and answer some of the longstanding questions about what’s in PUDL and how to navigate it.
In a similar vein, we’re going to try and improve the process of contributing to PUDL, whether through code or useful information about the data. Perhaps an energy data wiki?
Lastly, for those of you that offered, we might reach out for support along the way! We want PUDL to be useful for you, and the best way to ensure that is to involve you in the process.
Stay tuned on our progress by following along on GitHub, and, as always, reach out if there is something you’d like to see us do.
We recently found out that Kamran Tehranchi, one of two primary maintainers of the PyPSA-USA open source power system model, was working on adapting it to use open data that we publish through our Public Utility Data Liberation Project (PUDL), so we interviewed him over email to find out more about his experience making the switch.
Can you tell us a little bit about yourself? What problems are you working on? Where are you at?
Sure! I’m currently a PhD Student at Stanford University working in the Interdisciplinary Energy Systems (INES) Lab. By way of my research, I am also an energy system modeler and open-source software developer. My work focuses on electricity system planning, specifically on the impact of electricity transmission resolution within planning models. I primarily work with engineering-economic simulation and optimization models, mainly production cost simulations and capacity expansion models. I use these models to design and simulate future energy systems to understand the impacts of emerging technologies, policies, and climate-energy system interactions. One of the main projects I’ve been working on this past year is the PyPSA-USA planning model which in-part leverages PUDL to develop the electricity system data model.
Linking power plant financial data to energy system operational data with help from Climate Change AI
At the end of 2023, Catalyst wrapped up work funded by a Climate Change AI (CCAI) Innovation Grant using entity matching (record linkage) to connect the energy system financial data reported to the US Federal Energy Regulatory Commission (FERC) and physical energy system data reported to the US Energy Information Administration (EIA). While the data published in FERC Form 1 refers to the same utilities, power plants, and generators that are reported by EIA, these entities lack common IDs to link them. This connection between datasets is necessary to show that retiring certain fossil fuel power plants in favor of renewable energy sources is economically beneficial and technically feasible while still meeting the physical demands of today’s grid. Conducting entity matching to model this connection eliminates the extremely laborious process of sifting through these datasets and performing a manual connection. In collaboration with and support of RMI’s Utility Transition Hub, Catalyst created a small validation dataset of manually linked records, and thus know first hand the tedium of conducting this linkage manually.
Over the course of the grant period we developed the connection of FERC Form 1 plants to EIA data from a one-off module to an integrated analysis maintained and deployed with our nightly PUDL builds. Along the way, we updated our FERC-FERC plant connection (the plant_id_ferc1 column in out_ferc1__yearly_all_plants in the PUDL database), providing a unique plant ID to link FERC plants across all years of reporting. We believe our published output table of connections (out_pudl__yearly_assn_eia_ferc1_plant_parts in the PUDL database) is the only regularly updated, free and open-source connection between the FERC and EIA datasets.
We hope the result enables advocates working to decarbonize our electricity system to more easily bring defensible and data-driven analyses to state-level legislative and regulatory processes. Additionally, we hope that the published matching framework can serve as an open-source example of record linkage for energy datasets and be a model for attempting similar connections with other energy datasets.
Inputs
The data published in FERC Form 1 is messy; reported records correspond to an assortment of generator aggregations (e.g. prime mover, primary fuel source, technology type, plants, or generator units). To create an EIA input that could match the diversity of records reported in FERC Form 1, we created the EIA “plant parts table”. This table contains aggregations of all EIA “plant parts” corresponding to the various granularities appearing in the FERC data.
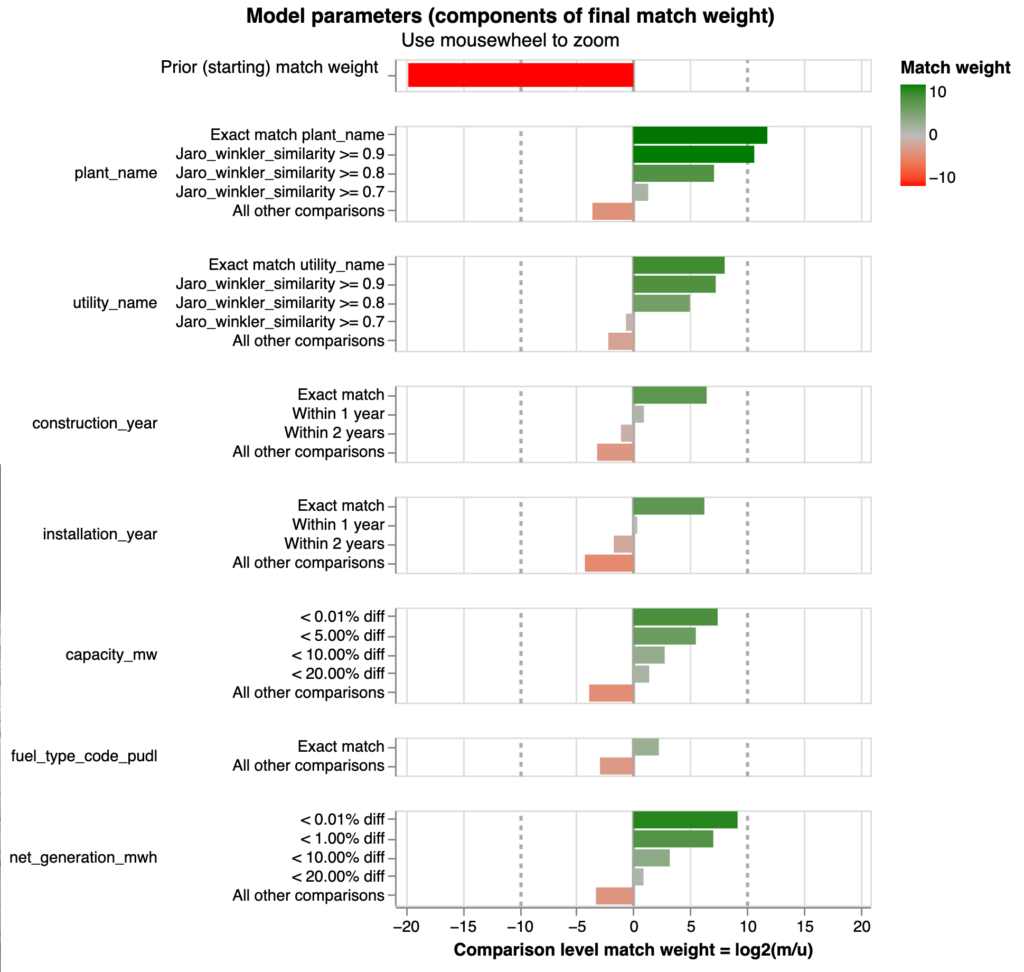
After experimenting with several machine learning packages, we decided to use the open-source Python package Splinkas it provided helpful transparency into the effects of changing model parameters and produced results better than our existing baseline. Splink is an entity matching and deduplication interface based on the Fellegi-Sunter algorithm for record linkage. Its main advantages are its speed working with data locally, its interface for users to define fuzzy matching logic between attributes in the input datasets, and its features for doing an unsupervised match (with no training data). Splink provides interactive charts of the model weights that make it easier for downstream users to provide feedback without advanced understanding of the underlying model mechanics.
Results
We used the manually matched dataset to evaluate the model results by a metric of precision and recall. Consider the set of FERC records in this manual validation dataset that the model predicted a matching EIA record for. Precision is the percentage of these matches that are correct. It represents the model’s accuracy when making a prediction. Now, consider all of the FERC records in the manual validation dataset. Recall is the percentage of these FERC records that the model predicted an EIA match for. It represents the model’s coverage of the FERC dataset. The table below displays the precision and recall of the Splink model alongside a baseline linear regression model that was previously integrated into PUDL. The “match probability threshold” is the threshold at which pairs with a lower probability of matching are labeled as a non-match. As the match threshold decreases, more record pairs are labeled as a match and the recall increases. However, precision decreases as the match threshold decreases because the match quality is lower and more FERC records are matched to an incorrect EIA record. Considering the needs of downstream users, we prioritized publishing match results with high precision and thus chose a match threshold of .9 for use in our deployed model.
Match Probability Threshold
Precision
Recall
.95
.944
.833
.9
.943
.843
.75
.940
.862
.5
.939
.875
.25
.938
.887
baseline
.90
.73
Challenges and Limitations
One of the initial challenges we encountered during the project was the high percentage of null values in the input datasets. This significantly impacted the quality of our entity matching results. Additionally, our manually compiled training/validation dataset was relatively small and inherently introduced some unknown biases within the small sample size. Recognizing the dynamic nature of data over time and the potential shifts in representation as more data is published, we additionally experimented with the unsupervised training features for the Splink model. Results were similar to those of the supervised model, and we anticipate using the unsupervised model in the event that the existing training data becomes too outdated or fails to represent evolving patterns in the data. This forward-looking approach ensures adaptability to new data trends and optimizes for scenarios not adequately represented in the initial training dataset.
What’s Next?
With the development of this framework for entity matching, Catalyst is capable of greater flexibility and efficiency in data-driven model development. In 2024, we are building on this framework using funding from the Mozilla Foundation to link Security Exchange Commission utility ownership data to EIA utility operational data. We hope to leverage these models to address analogous issues in natural gas data in the future.
Catalyst is making exciting progress in providing open data to electricity resource planning models like the GridPath RA Toolkit with support from GridLab. Our initial work on these inputs has revealed that there is a need for entity matching in almost all of the datasets under consideration. For example, the Western Electricity Coordinating Council’s Reliability Modeling Anchor Data Set (WECC ADS) has transmission node IDs, generator IDs, and utility IDs that do not match other data sets referring to the same entities. We are excited to utilize the resource efficiency, usability, and transparency of Splink in building entity matching models for these datasets.
Please reach out to us with questions about the modeling process or resulting connection table, and let us know how you are utilizing the FERC to EIA connection!
We’re excited to announce that you no longer have to install the PUDL Python library to access electric generation data linked across FERC and EIA such as capacity factor, heat rate, and fuel cost. These, and many others, are now available directly in the PUDL database, which you can download from Zenodo here. You can find more details on how to access the data here.
We were able to complete this large infrastructural overhaul with the help of generous funding from the Sloan foundation.
Now that you can use any tools you want to analyze the data, here are some ideas:
Use another language you like better: R, Rust, Ruby, or even other languages that don’t start with R (Julia?)
Use Kaggle to check out our data without installing any programming environments at all!
Hook up a BI tool to quickly generate low/no-code dashboards and visualizations!
Since we’re moving away from downstream use of the library, we are also deprecating the PudlTabl class. It will still work, for now, but it’s now just a shell around accessing the database tables and will be removed in a future release.
One further change we made during all of this was to rename a bunch of tables to make them a little easier to find and understand. Tables now have standardized prefixes, the nuances of which are explained in the docs. The short version is:
When in doubt, start with tables with the out_* prefix. These have been cleaned and connected into wide tables with lots of metadata and are designed to be easy to use for downstream analysis.
When you need to dig deeper, look at the core_* tables. These are the cleaned up building blocks of the out_* tables. You may need to join several core_* tables to get the metadata you want.
The tables starting with an underscore are intermediate assets. They’re not stable, so please don’t rely on the data in them.
We hope these changes make it easier for a wider variety of users to use our data! Now that we’ve wrapped up this infrastructural work, we’ll shift our focus back to integrating new datasets like PHMSA and EIA 176.
If you want help getting started with our data, or have any datasets you’d like us to integrate, we’d love to talk: drop by our office hours and we’ll walk you through any questions you might have.
We’ve been working on our goal-setting process at Catalyst, and want to share our high-level goals for the summer – these take us through September 2023.
Publish all data products as SQL tables
In the past, we’ve published data products in two ways: a large portion of our data was published in SQLite/Parquet files; the rest, including many of our analysis outputs, were calculated directly in the PudlTabl Python class. You could interact with the SQLite and Parquet data any way you wanted. However, to access the latter, you’d need to install the latest version of PUDL and all its dependencies. Maintaining that environment and managing the dependencies was an unnecessary barrier to data analysis.
You may have noticed, from our nightly builds, that more and more of the outputs from PudlTabl are stored directly in pudl.sqlite. We’ve been working on this transition for a few months, since the Dagster migration, and finally have just a few data products remaining: the MCOE outputs (heat_rate_by_unit, heat_rate_by-generator, fuel_cost_by_generator, capacity_factor_by_generator, and mcoe) and the plant parts list (mega_generators, plant_parts_eia). Soon, you’ll be able to access all of our data without installing the PUDL Python package!
This also means PudlTabl will soon be deprecated, and the preferred way to access our data will be through conventional SQL and Parquet tooling such as Datasette, SQLAlchemy, or RSQLite.
Integrate new datasets into PUDL
We also plan to integrate some shiny new datasets, starting with PHMSA data. This contains operational data about methane gas gathering, transmission, and distribution in the US. After a stretch of infrastructure investment, we’re excited to focus on the “integrate new datasets” part of our partnership with Sloan! We’re doubly excited to expand into the methane gas aspect of US energy system data.
Integrate 2022 data for existing datasets
We’re working with RMI to integrate the 2022 data from our existing datasets, such as FERC forms 1/2/6/60/714 and EIA forms 860/860m/861/923. Each year, new data brings new challenges, but this quarter we plan to build automation tooling to help us detect issues as they arise and reduce the manual work required each year. This will be especially important as the annual data reconciliation requirements will increase when we integrate new datasets. This year, we’re especially interested to see how the FERC XBRL data has changed since its debut in 2021.
Support RMI’s financial modeling efforts
We are also pleased to provide development and architectural support for RMI’s Optimus financial modeling tool. Optimus can show utilities how IRA incentives make cleaner portfolios better long-term investments, aid commercial partners in quantifying the distributional impact of their electrification plans, and support advocates by showing how ratemaking can evolve to minimize the burden of the transition on LMI customers. We’re helping RMI revamp the engineering side of their system to support faster, more confident development of the model.
Apply automated entity matching techniques
We’ve been working with CCAI on entity-matching problems in the energy data space. So far, we’ve been experimenting with using Splink to match EIA and FERC plant IDs. This summer, we’re hoping to bring that process into PUDL and generalize it to other problems such as inter-year FERC to FERC plant ID matching.
Meet new people and organizations!
Of course, we’re also looking to connect with exciting new people! We’re looking for new contributors, grant funders that are interested in PUDL development and maintenance, and organizations that could benefit from our blend of energy policy domain knowledge and data engineering/data science expertise. If that sparks any connections in your mind, please drop us a line at [email protected].
It’s been almost a month since we pushed out our first actual quarterly software and data release: PUDL v0.5.0! The main impetus for this release was to get the final annual 2020 data integrated for the FERC and EIA datasets we process. We also pulled in the EIA 860 data for 2001-2003, which is only available as DBF files, rather than Excel spreadsheets. This means we’ve got coverage going back to 2001 for all of our data now! Twenty years! We don’t have 100% coverage of all of the data contained in those datasets yet, but we’re getting closer.
Beyond simply updating the data, we’ve also been making some significant changes to how our ETL pipeline works under the hood. This includes how we store metadata, how we generate the database schema, and what outputs we’re generating. The release notes contain more details on the code changes, so here I want to talk a little bit more about why, and where we are hopefully headed.
If you just want to download the new data release and start working with it, it’s up here on Zenodo. The same data for FERC 1 and EIA 860/923 can also be found in our Datasette instance at https://data.catalyst.coop
In August we put out a new PUDL software and data release for the first time in 18 months. We had a lot of client work, and kept putting off doing the release, so a whole lot of changes accumulated. Some highlights, mostly based on the continuously updated release notes in our documentation:
New Data Coverage
EIA Form 860 added coverage for 2004-2008, as well as 2019.
EIA Form 860m has been integrated (through Nov 2020). Note that it only adds up-to-date information about generators (especially their operational status).
EIA Form 923 added the 2001-2008 data, as well as 2019.
EPA CEMS Hourly Emissions covering 2019-2020.
FERC Form 714 covering 2006-2019, but only the table of hourly electricity demand by planning area. This data is still in beta and the data hasn’t been integrated into the core SQLite database, but you can process it on the fly if you want to work with it in Pandas.
EIA Form 861 for 2001-2019. Similar to the FERC Form 714, this ETL runs on the fly and the outputs aren’t integrated into the database yet, but it’s available for experimental use.
US Census Demographic Profile 1 (DP1) for 2010. This is a separate SQLite database, generated from a US Census Geodatabase, which includes census tract, county, and state level demographic information, as well as spatial boundaries of those jurisdictions.