Catalyst is pulling together an estimate of the marginal cost of electricity (MCOE) for every natural gas and coal fired power plant in the US whose data we can get our hands on. We’re using data from the EIA 923, EIA 860, and FERC Form 1 to do it. Getting the heat rate right for each generator is an important part of this calculation, but a lot of the required data is… not perfect. Here’s how we’re working through it.
We were going to have to explain this process to our partners at CPI anyway, so we figured why not just make a public post out of it, as an example of the kinds of things that we’re doing with our PUDL Database. The MCOE is super relevant right now with the crazy cost-of-service regulation proposal being floated by DOE at FERC.
One challenge in this calculation is the fact that the EIA collects fuel cost data on a per-plant basis, fuel consumption is reported on a per-boiler basis, and electricity generation is attributed to each generator. Somehow we need to bring all of that data together to get an estimate of the fuel costs per MWh of generation, so we can compare different generators, and help target the most expensive ones for early retirement.
We know how much electricity each generator put onto the grid, but to know how much fuel went into making that electricity, we need to know the heat rate (heat input per unit electricity output) of the generator. Once we know how much heat went in, we can look at the fuel cost per unit heat content — for that type of fuel at that particular plant at that time — and calculate how much the fuel actually cost.
In the ideal case, where we know all of the connections between plants, boilers, and generators, and have good cost, fuel, and generation data, here’s what the heat rate calculation looks like:
- Pull a dataframe from the PUDL database that has plant_id and generator_id, and the net generation of each generator on an annual basis.
- Merge that dataframe with the boiler-generator association table, so we know which boilers were associated with what generation.
- Group that dataframe by report_year, plant_id, boiler_id and sum the net generation. Now we know the total generation each boiler contributed to… but several boilers can be hooked up to the same generator, and several generators can be hooked up to the same boiler, so we need to give each boiler just it’s share of the net generation.
- Group that same dataframe by report_year, plant_id, boiler_id, and generator_id, and again sum the net generation. This gives us the net generation that each boiler-generator pair was responsible for.
- Merge the results of those sums, and apportion fuel consumption associated with each boiler to its associated generators, in proportion to the share of the boiler’s associated generation that that generator was responsible for.
- Group by generator, and sum the fuel consumed. Now we have an absolute amount of fuel (in mmBTU) associated with each individual generator.
- Merge back in the net generation associated with each generator, and calculate the heat rate (mmBTU/MWh).
Once we’ve got the heat rate, we can go back and look at the plant level fuel costs. Luckily, even though which generator consumed which fuel isn’t specified, we know from other data that typically more than 99% of the gas goes to the gas generators, and all the coal goes to the coal generators. This allows us to partition fuel costs according to the type of generator, in proportion to both the generator’s heat rate and its net generation.
Of course, it turns out that we aren’t always working with the ideal case. Which is why we get paid the big bucks (we wish!).
Orientation: Plant Level Average Heat Rate
To orient ourselves to the data, first we did a relatively easy calculation — every fuel delivery, boiler fuel, and generation record in the EIA923 data has a plant ID associated with it, so calculating a plant-wide average heat rate is straightforward. Here’s what that distribution looks like, when weighted by the net generation of each plant:
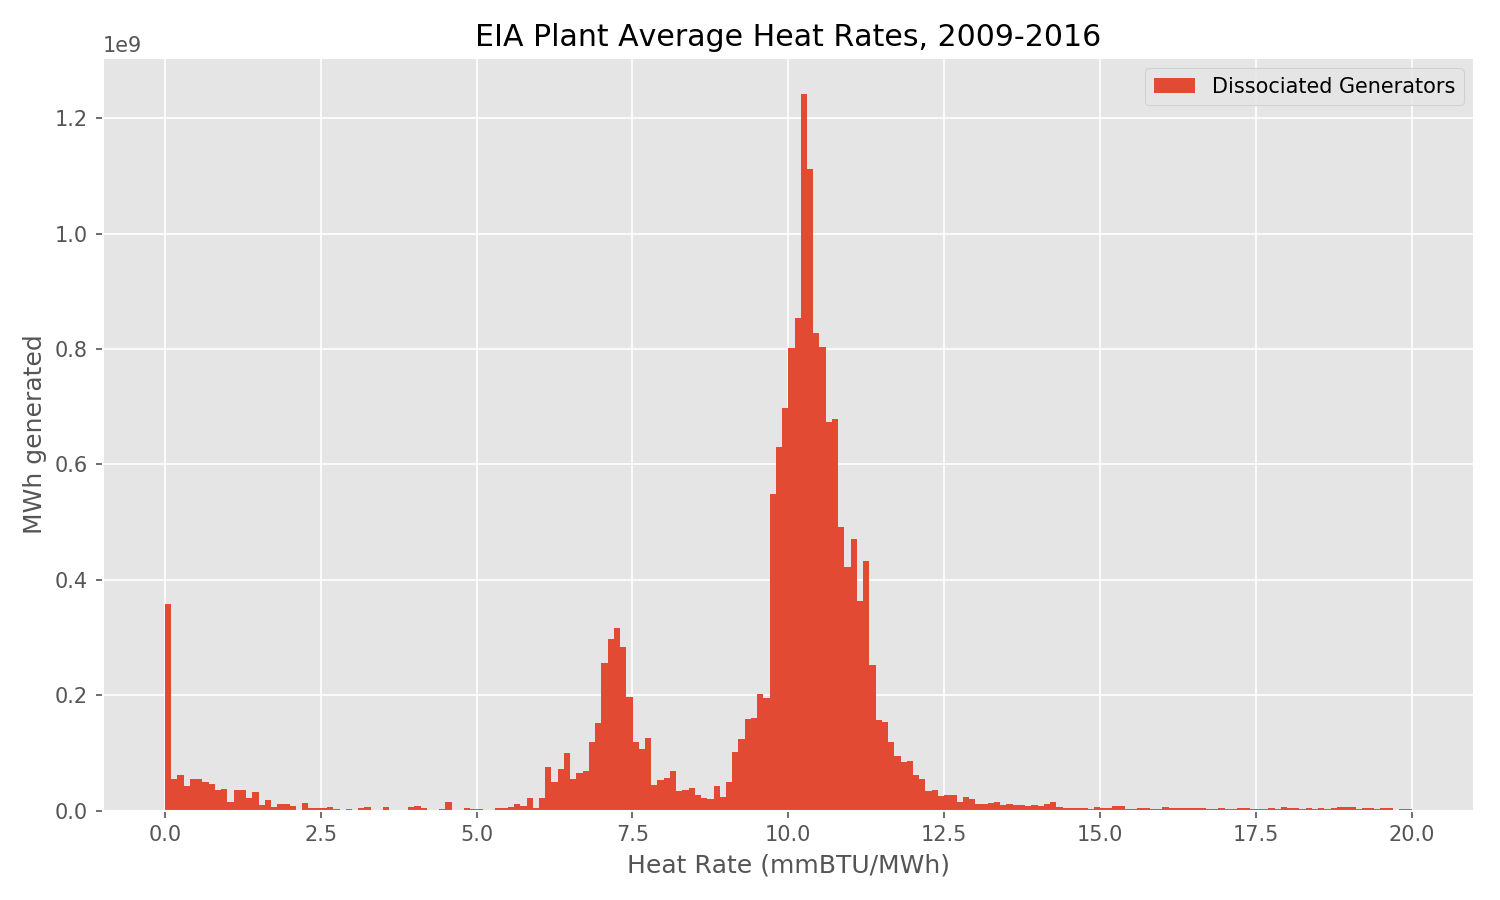
Coal fired power plants (and steam turbines more generally) have heat rates of around 10 (in mmBTU/MWh). Gas combustion turbines (CTs) are more like 11-12, and combined cycle natural gas plants (which send the exhaust heat from a combustion turbine into a steam turbine), average around 7.5 The most efficient combined cycle plants in the world have heat rates of around 5.5 (which is about 62% thermal efficiency). Some plants are a mix of different kinds of generators, so we know this isn’t going to be an accurate picture of generator-level heat rates, but it’s an easy calculation, and gets us oriented.
The big peak between 10 and 12 looks like coal and CTs. The little peak at 7.5 is pretty clearly combined cycle plants. But what’s that crap down below 2.5? And why does the right tail head off to 20 and beyond?
A little digging showed that the unreasonably high heat rates (they stretch all the way out into the hundreds of mmBTU/MWh) are the result of parasitic loads in plants with low capacity factors. There are also some negative heat rates for the same reason. Power plants use electricity too, and we’re looking at their net generation here. When the power plant’s own power consumption is similar to, or even larger than it’s net generation, the heat rates are no longer representative of how thermally efficient the plant is. This usually happens when a plant doesn’t get used much. Weighting the histogram by net generation crushes these crazy heat rates to nothing on the Y-axis.
But the pile of junk near zero is big — even with the net-generation weighting — so we know there’s cleanup to be done.
Guilt by (Boiler Generator) Association
The EIA provides a table describing which boilers and generators are associated with each other in each power plant, but unfortunately it doesn’t always completely describe the connections between heat input and electricity output.
When we see a plant in that table that has all of the known boilers and all of the known generators listed, we say the plant is completely associated. Any boiler or generator that has ever been part of a completely associated plant probably still has the same physical connections. To capture that information we analyzed all the back-years of this table and compiled our own table of fully associated boilers and generators. Generators that have never been part of a fully associated plant are called unassociated.
This means that even if some new incompletely associated generators are added to a plant (e.g. some combined cycle turbines getting added at an old coal plant), the generators that we already had a complete association for remain associated.
The most common thing that messes up these associations is combined cycle generators. Virtually all of the heat consumption is attributed to the combustion turbine — which is also a generator. The steam turbine “doesn’t consume any fuel” since it runs almost entirely on the waste heat from the combustion turbine, but it does put out electricity. This gives it a very low apparent heat rate. So we expect to see the combined cycle plants as two lumps — one near zero, and one that looks like a combustion turbine.
Except, we shouldn’t see those separate lumps when we’re doing plant level averages… since at the plant level, we’ll capture all the electricity output from both generators, and all the heat that goes into the combustion turbine. So, this doesn’t seem to explain the lump near zero.
Here’s what the heat rates of the associated vs. unassociated generators look like:
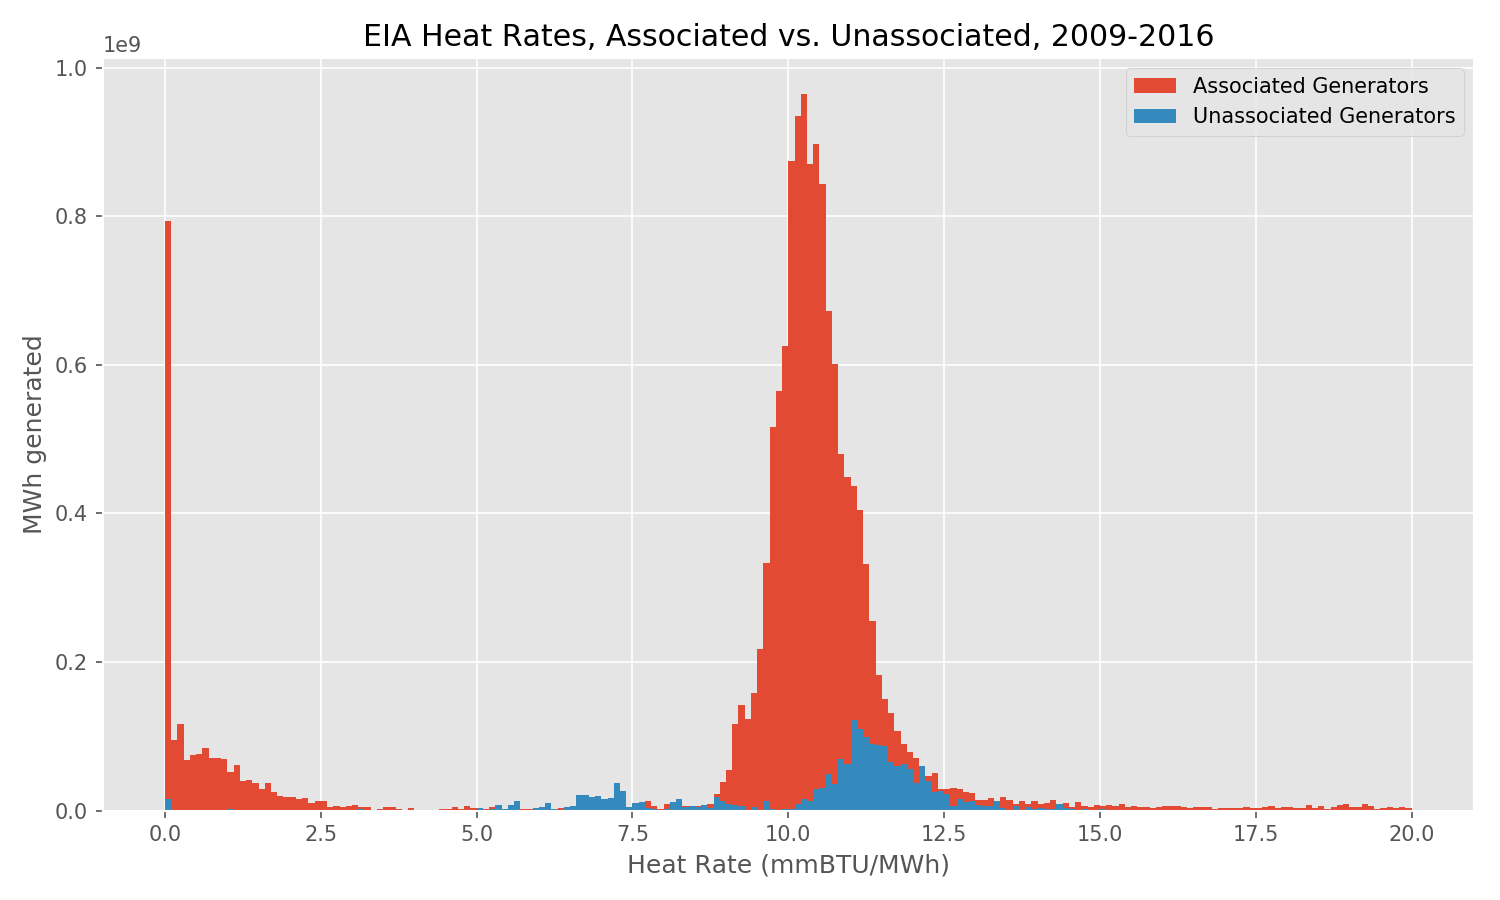
In the unassociated generators (blue) we have what looks like a pile of combustion turbines around 11 and a few nice combined cycle plants at 7.5. In the associated plants we’ve got an even bigger pile of junk near zero. Additionally, we seem to have lost nearly all of the combined cycle plants.
It could be that their steam turbines are what made the lump near zero bigger (now that they’re split out), and it seems likely that the unassociated combustion turbines are their better halves. But this means there’s a problem in the boiler-generator association table. Those two halves should be in the same category — either associated or unassociated.
Digging into our favorite test case, the Barry plant (it’s EIA plant 3, so it shows up at the top of the data tables… and also happens to be a very complicated plant) we discovered that for a bunch of years, some of its boilers just plain aren’t showing up in the boiler fuel table, even though the generators that are later associated with them are still there, and putting out electricity. This isn’t something we can fix. That’s bad data.
Right now our purpose is to create a collection of correct generator heat rates and marginal fuel costs, rather than an exhaustive catalog (which will take more time), so for the moment, we’re just going to try and remove the things that are clearly broken.
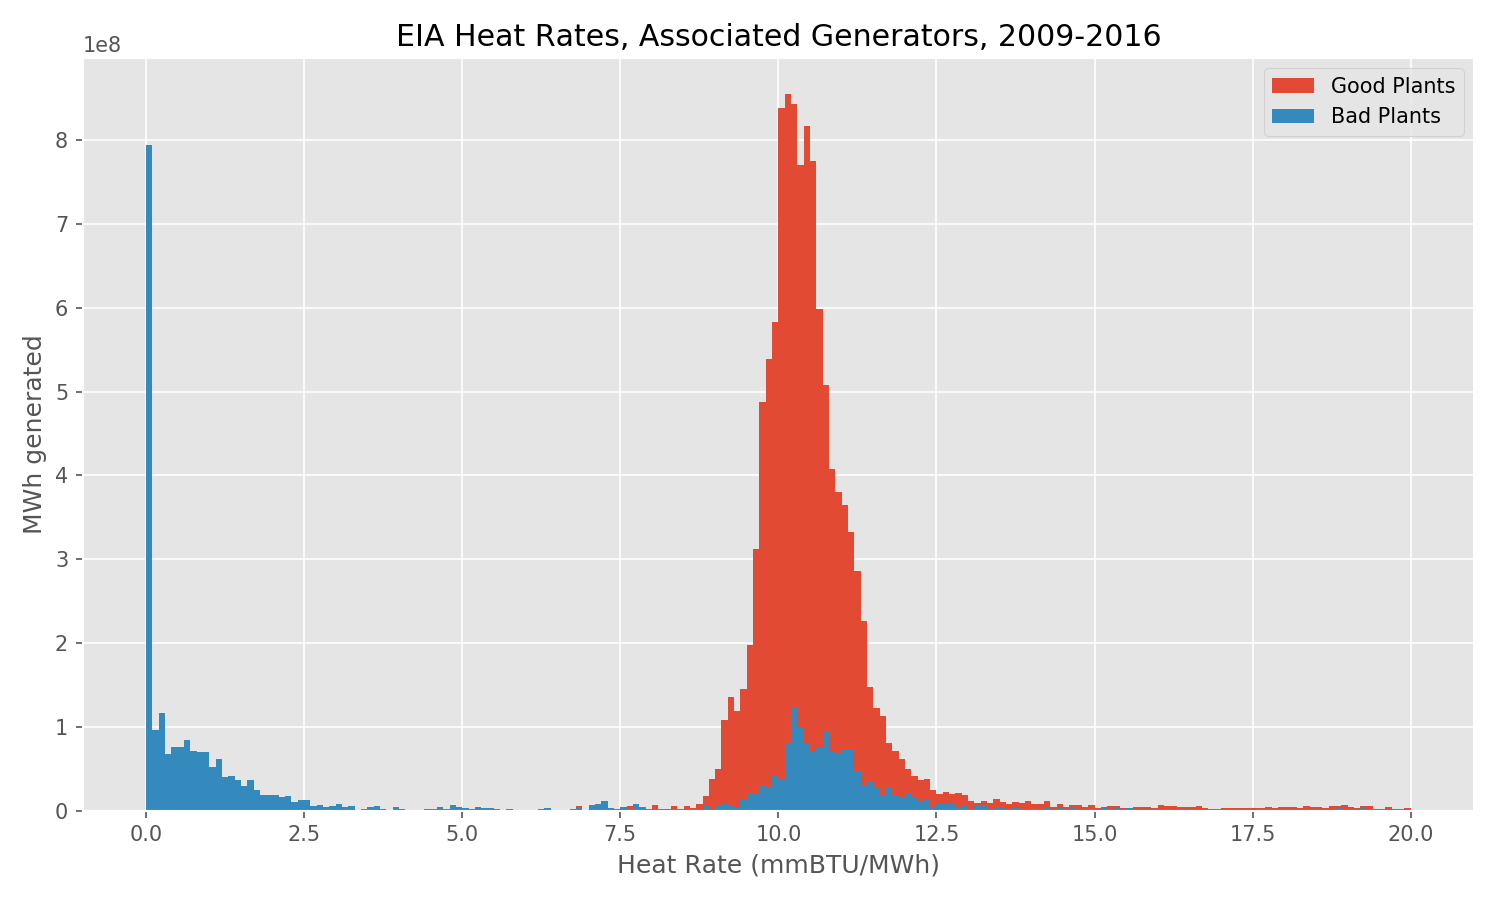
We created a list of all the “bad plants” which have a generator in the lump near zero, since it seems like many of them have something wonky going on with their data or boiler-generator associations. Here’s how the “good” vs. “bad” generator heat rates compare, for both the associated and unassociated generators:

The Good, the Bad, and the Fixable?
At this point, hopefully generators that are part of the “good” plants have reasonable heat rates that we can use to calculate fuel costs per MWh. Here’s what their distribution looks like, for both associated and unassociated generators:
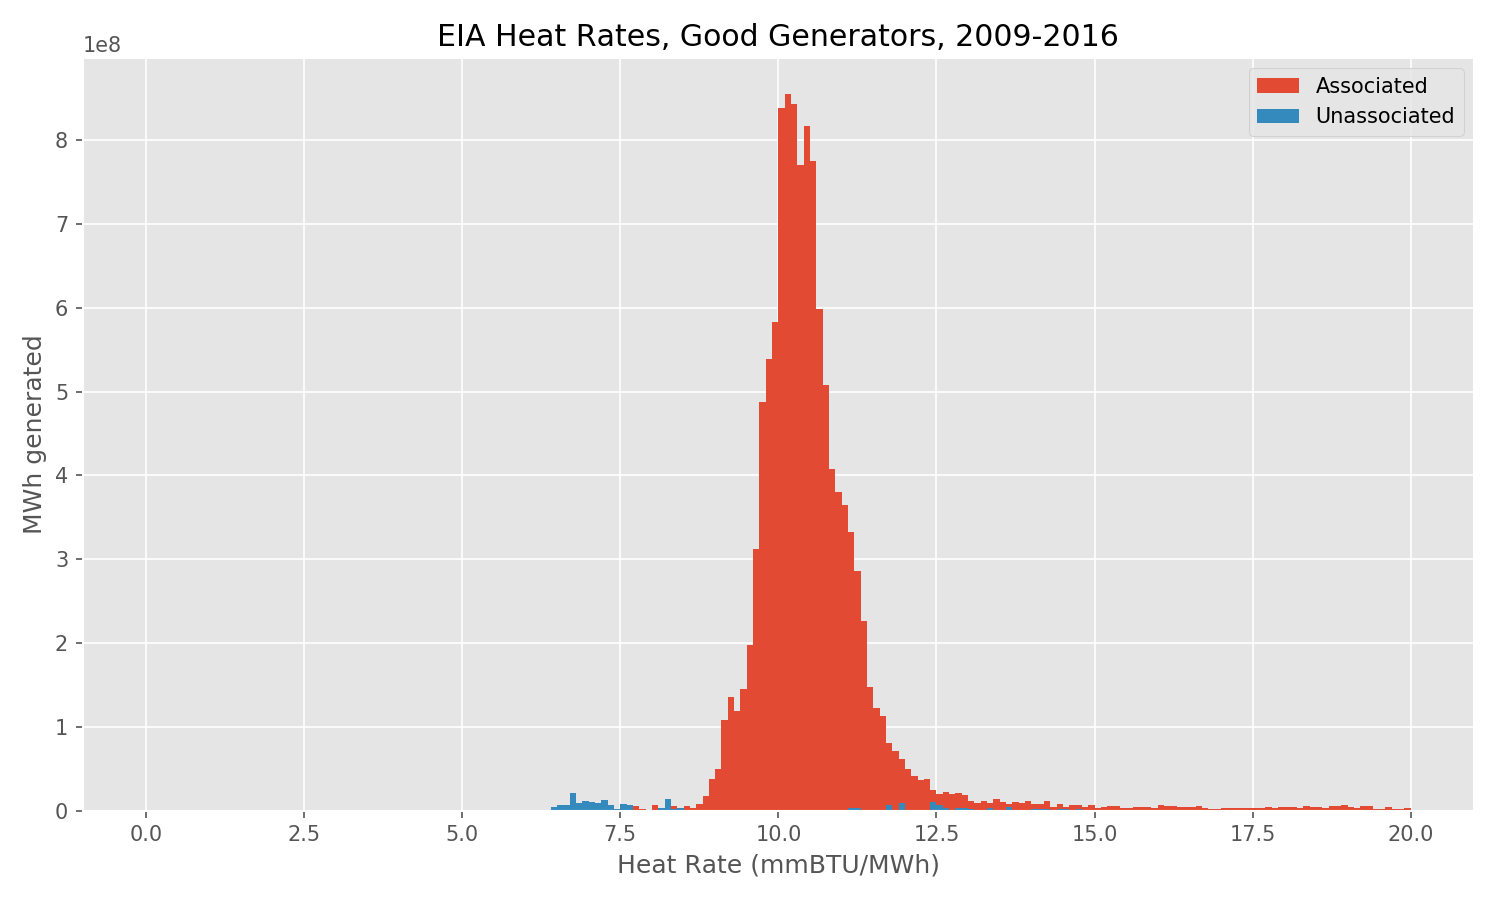
Sadly, there are virtually no combined cycle plants left, so this isn’t a very representative distribution of overall heat rates. But remember back at the beginning, there were some near-zero heat rates that we had no explanation for (they were showing up even in the plant level averages), and then there were some that we expected — the steam turbine parts of the combined cycle plants. If we dissociate the generators for the “bad” plants and calculate plant-level average heat rates for all of them, we should be able to differentiate between these two populations — those that are reasonable at the plant level, and those that are not, and then discard any generators from plants that have unreasonably low plant average heat rates.
Here’s what these “bad” plant average heat rates look like:
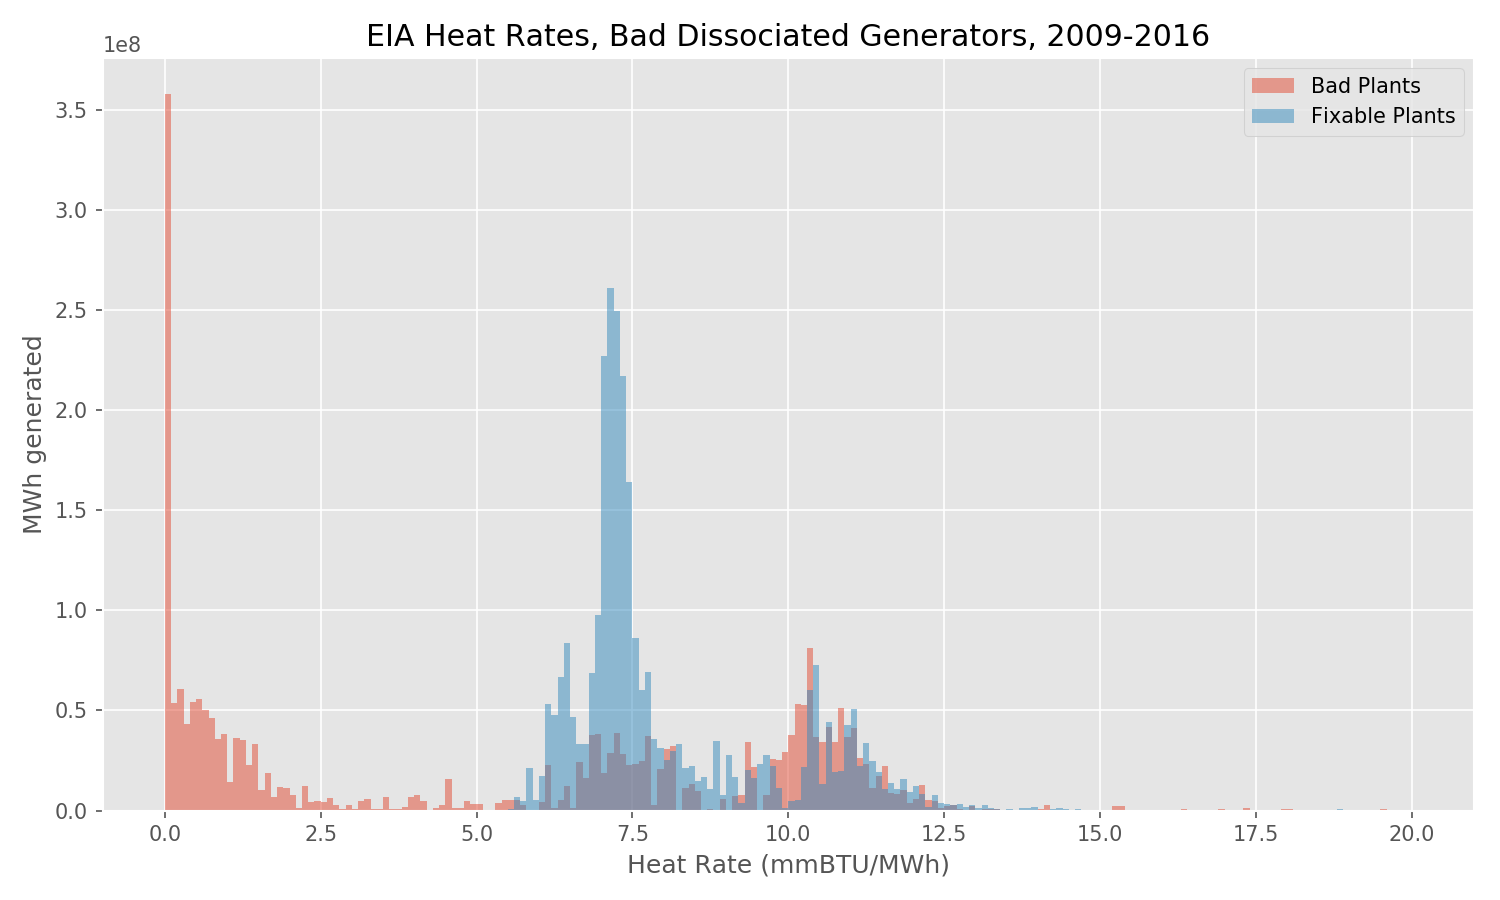
There’s an additional complication here though (because of course there is), which is that it’s possible to get a “reasonable” plant average heat rate even when you have some generators with bad data, that cause their heat rates to be close to zero — bad data, as opposed to being steam turbines that are part of a combined cycle plant — combined with other generators that have higher heat rates. Barry once again demonstrates this bad behavior, with the heat rates of its coal fired generators (10) and its mysteriously bad gas generators (0.2) averaging out to a reasonable combined cycle heat rate (7.9).
To avoid that particular failure mode, we eliminated any multi-fuel plants, as well as any plants with average heat rates below 5.5 mmBTU/MWh, from the plant average heat rate distribution, and called the remainder the “fixable” plants.
Getting it Together
Now we can bring together the good associated generators (that have honest-to-god per-generator heat rates), the good unassociated generators (that have accurate plant average heat rates), and the fixed generators (plant average heat rates we could recover from the “bad” plants) and see what we’ve got left to work with:
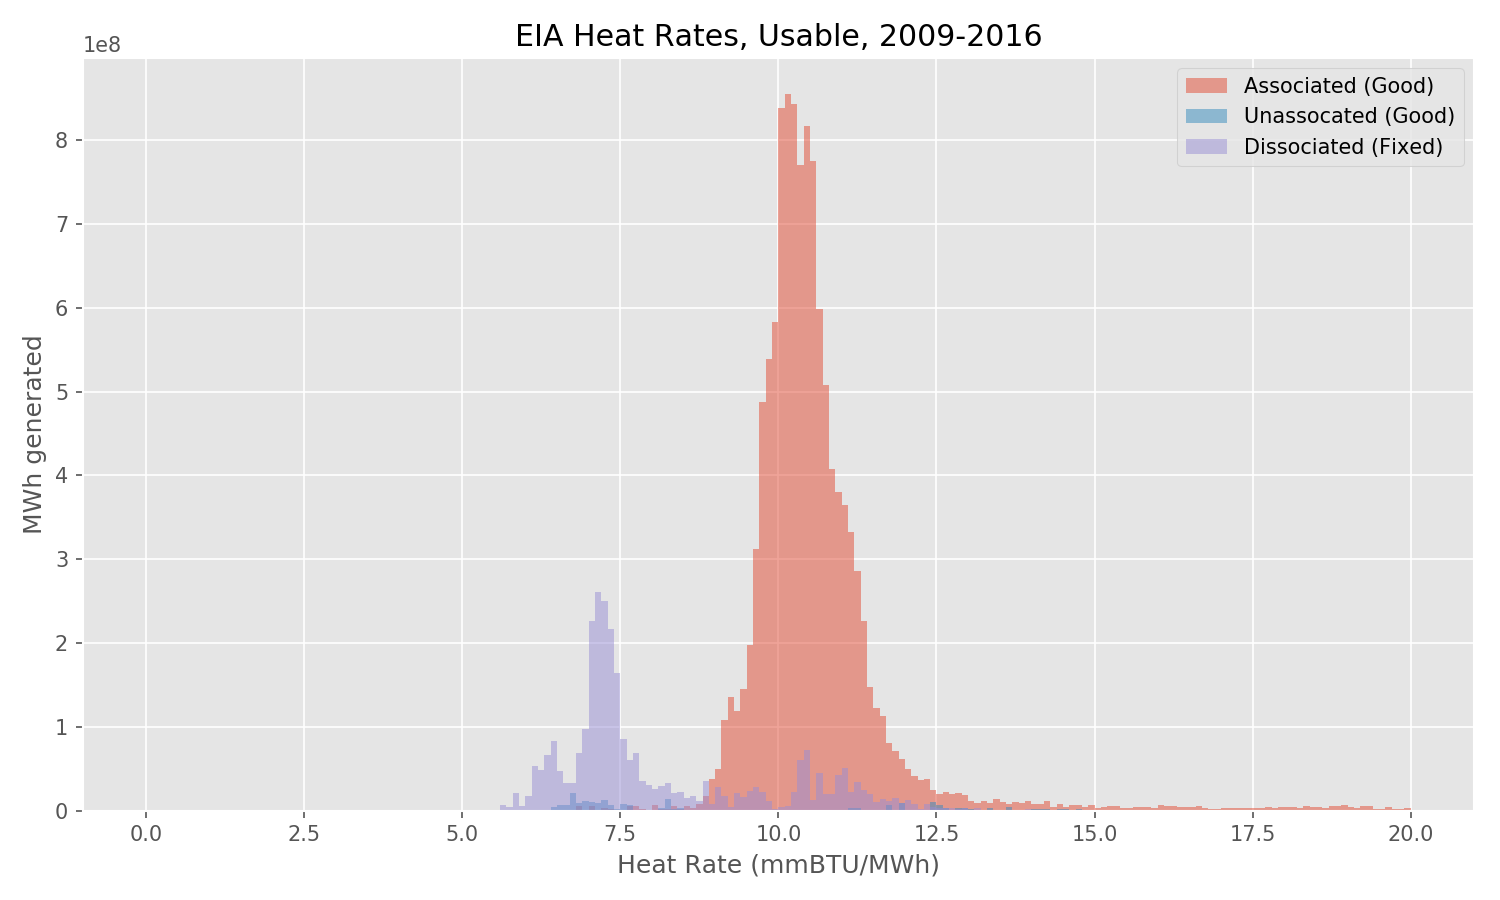

All in all, this clean(er) data set still contains 21,569 annual generator heat rate estimates, from 1,537 plants and 4,181 separate generators.
Room for Improvement
- What are other ways that “reasonable” heat rates could end up in the fixable plants? Are they really fixable? Or more fixable?
- Need to refine the algorithm that identifies generators as “completely” associated, to be on the lookout for missing data — as was the case with Barry — and not accidentally mark such generators as completely associated.
- In unassociated plants, we could still refine the heat rate estimates further, partitioning heat input by fuel type, and associating gas heat input with the gas generator output, and coal heat input with the coal generator output, even if there aren’t good boiler-generator associations to work with — secondary fuels (e.g. gas for startup of coal plants) make up less than 0.5% of total heat input.
- We should be able to filter the generators by capacity factor, and set some minimum threshold to eliminate the ridiculously high and negative heat rates that result from parasitic loads which are comparable to or larger than the plant’s net generation.
- All the data we’re working with here is actually reported on a monthly basis… so we could do exactly the same calculation monthly, if we wanted to. We’re doing it annually because eventually, this is going to get merged with non-fuel production costs that come from FERC Form 1, and that data is annual. But we should probably hold off on doing the downsampling until that merge actually takes place.