- Chapter 4 of the 2018 National Climate Assessment looks at the potential climate impacts on the US energy system.
- Flow of Flows — Orchestrating ELT with Prefect and dbt. More exploration of how to build data processing pipelines using open source tooling.
- Orchestrating Airbyte data connection tasks with Prefect. Official integrations for Airbyte connectors as Prefect tasks.
- Data cleaning IS analysis, not grunt work. A longish post exploring what we really get out of doing data cleaning, and why it’s more valuable and complex than it often gets credit for.
- Peer learnings about what it means to become an open data steward, from the 2021 ODI Open Data Summit. Videos and responses from participants on many facets of stewarding open data, especially as a business / organization.
Tag: open data
New PUDL Software & Data Release: v0.4.0
In August we put out a new PUDL software and data release for the first time in 18 months. We had a lot of client work, and kept putting off doing the release, so a whole lot of changes accumulated. Some highlights, mostly based on the continuously updated release notes in our documentation:
New Data Coverage
- EIA Form 860 added coverage for 2004-2008, as well as 2019.
- EIA Form 860m has been integrated (through Nov 2020). Note that it only adds up-to-date information about generators (especially their operational status).
- EIA Form 923 added the 2001-2008 data, as well as 2019.
- EPA CEMS Hourly Emissions covering 2019-2020.
- FERC Form 714 covering 2006-2019, but only the table of hourly electricity demand by planning area. This data is still in beta and the data hasn’t been integrated into the core SQLite database, but you can process it on the fly if you want to work with it in Pandas.
- EIA Form 861 for 2001-2019. Similar to the FERC Form 714, this ETL runs on the fly and the outputs aren’t integrated into the database yet, but it’s available for experimental use.
- US Census Demographic Profile 1 (DP1) for 2010. This is a separate SQLite database, generated from a US Census Geodatabase, which includes census tract, county, and state level demographic information, as well as spatial boundaries of those jurisdictions.
Environmental Justice Data Liberation
We’ve come across a few allied projects looking at environmental justice data specifically, and thought it would be nice to share!
Environmental Enforcement Watch
In May, Christina and I gave a talk at CSV,Conf,v6 about things we’ve learned liberating US energy system data. We focused a lot on the challenge of making data accessible to advocates. The following talk was analogous, but focused on environmental justice data. The speaker was Kelsey Breseman (@ifoundtheme) from the Environmental Data and Governance Initiative (EDGI) and their project Environmental Enforcement Watch (EEW). EEW is trying to hold polluters accountable using federally reported data, by making that data more accessible to and understandable by the people who are affected. They’re scraping the data from the web and creating a database that folks can query using Google CoLab notebooks. At the same time they’re trying to get EPA the full underlying database accessible to the public.
You can watch her excellent talk here:
I was struck by how many parallels there were between our work. We’re both trying to mitigate the poor curation of government data, and make it more accessible way to the public. EDGI also seems very open and GitHub centered and is trying to operate as a horizontal organization. They support themselves through foundation grants and volunteer labor. Nobody works on EDGI full time. They have a fiscal sponsorship agreement through Earth Science Information Partners (ESIP).
If you’re interested in public data and environmental justice they seem like a great organization! Maybe we can collaborate at some point.
Automated Data Wrangling

We work with a lot of messy public data. In theory it’s already “structured” and published in machine readable forms like Microsoft Excel spreadsheets, poorly designed databases, and CSV files with no associated schema. In practice it ranges from almost unstructured to… almost structured. Someone working on one of our take-home questions for the data wrangler & analyst position recently noted of the FERC Form 1: “This database is not really a database – more like a bespoke digitization of a paper form that happened to be built using a database.” And I mean, yeah. Pretty much. The more messy datasets I look at, the more I’ve started to question Hadley Wickham’s famous Tolstoy quip about the uniqueness of messy data. There’s a taxonomy of different kinds of messes that go well beyond what you can easily fix with a few nifty dataframe manipulations. It seems like we should be able to develop higher level, more general tools for doing automated data wrangling. Given how much time highly skilled people pour into this kind of computational toil, it seems like it would be very worthwhile.
Like families, tidy datasets are all alike but every messy dataset is messy in its own way.
Hadley Wickham, paraphrasing Leo Tolstoy in Tidy Data
In the past two weeks, Catalyst partners Energy Innovation and the Rocky Mountain Institute have released two major resources based on open data to help stakeholders better understand the energy transition in the US electricity sector. We’re excited to say that Catalyst team members prepared data from Catalyst’s Public Utility Data Liberation project and provided analytical support for both resources.
Energy Innovation’s Coal Cost Crossover 2.0 provided an update to their 2018 report, which projected that by 2025 three quarters of the nation’s coal power plants would be uneconomic. The 2.0 shows that the economics of coal power in the US have deteriorated more rapidly than expected. The report finds that 80% of existing coal plants are either uneconomic or slated to retire before 2025. Economic viability is assessed by comparing coal plant operating costs with estimates of building new renewable facilities nearby, using the levelized cost of wind and solar energy estimates from the National Renewable Energy Laboratory’s Renewable Energy Deployment System (ReEDS) model. Coal operating costs are derived from fuel and operations/maintenance data from FERC and EIA, or from estimates from the National Energy Modeling System where FERC and EIA data was unavailable.
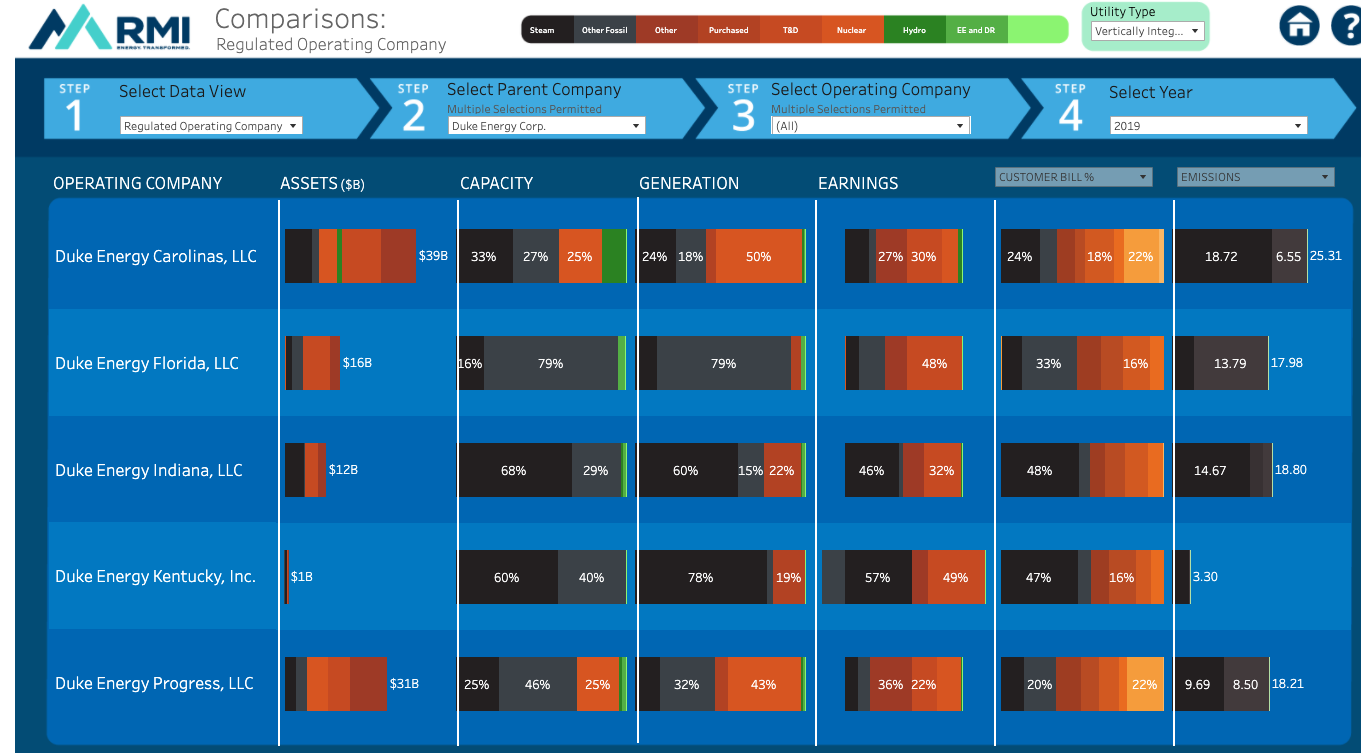
The Rocky Mountain Institute recently released the first version of their Utility Transition Hub, an interactive data portal that allows users to track, quantify, and understand how investments, operations, policies, and regulations shape outcomes in the electricity sector. Stakeholders can explore the energy transition in the power sector as a whole, group subsidiary utilities by their parent company, or make comparisons between utilities. Cleaned data from FERC and EIA underly Tableau visualizations which help users to evaluate historical performance on emissions reductions and investments in renewables, and to assess the alignment of resource planning and climate commitments with a 1.5 degree C trajectory.

Publishing PUDL with Datasette
Users have been asking for live access to our data forever, either via a PUDL API or a web interface, but we didn’t feel like we had the resources to maintain that kind of service and ensure it was reliable. Then a few weeks ago we came across an awesome open source project called Datasette that takes SQLite databases, wraps them in a Docker container, and lets users explore the data with their web browser.
It’s perfect for publishing read-only, infrequently updated data. That’s exactly what we’re doing with PUDL, and we’re already storing the data in SQLite, so it only took an afternoon to get the development version of our databases published. This goes a long way toward satisfying some of our data access goals for less technical users, which we touched on a few weeks ago in this post.
Our Datasette instance can be found at https://data.catalyst.coop and it contains both the raw FERC Form 1 DB, with all of the Form 1 data from 1994-2019, and our PUDL DB, which includes the EIA 860 and EIA 923 data from 2009-2019, and the subset of the (113!) FERC Form 1 tables that we’ve taken the time to clean up so far.
The system has already made it easier for us to collaborate and share the huge pile of data we’ve compiled over the last four years. We’re looking forward to using this system to get our data into the hands of more users.
Just a few examples of custom SQL queries or whole tables:
- A map of all the power plants in the EIA 860
- All coal deliveries from mines in Wyoming to plants in Colorado (with a map)
- All fuel deliveries to plants in North Carolina (with a map)
- All FERC Form 1 records pertaining to Tri-State Generation & Transmission (which showed up in FERC 1 for the first time in 2019 because they’re shopping around for a more friendly jurisdiction than Colorado…)
Please give it a spin, and let us know what you think! This is still experimental, and the interface will probably evolve. If you find problems, feel free to create an issue on GitHub, or drop us a line at pudl@catalyst.coop. Also, we’re still hoping to get the EIA 861 and FERC 714 integrated by the end of the year. See our Data We Wrangle page for additional datasets of interest. And if you’ve got other favorite tools for publishing live, open data, let us know in the comments.