Categories
updates

You Don’t Have to Install PUDL Anymore

We’re excited to announce that you no longer have to install the PUDL Python library to access electric generation data linked across FERC and EIA such as capacity factor, heat rate, and fuel cost. These, and many others, are now available directly in the PUDL database, which you can download from Zenodo here. You can find more details on how to access the data here.

We were able to complete this large infrastructural overhaul with the help of generous funding from the Sloan foundation.

Now that you can use any tools you want to analyze the data, here are some ideas:

  • Use the same type of Python code you have been using, but freed from our tangled web of dependencies!
  • Use another language you like better: R, Rust, Ruby, or even other languages that don’t start with R (Julia?)
  • Use Kaggle to check out our data without installing any programming environments at all!
  • Hook up a BI tool to quickly generate low/no-code dashboards and visualizations!

Since we’re moving away from downstream use of the library, we are also deprecating the PudlTabl class. It will still work, for now, but it’s now just a shell around accessing the database tables and will be removed in a future release.

One further change we made during all of this was to rename a bunch of tables to make them a little easier to find and understand. Tables now have standardized prefixes, the nuances of which are explained in the docs. The short version is:

  • When in doubt, start with tables with the out_* prefix. These have been cleaned and connected into wide tables with lots of metadata and are designed to be easy to use for downstream analysis.
  • When you need to dig deeper, look at the core_* tables. These are the cleaned up building blocks of the out_* tables. You may need to join several core_* tables to get the metadata you want.
  • The tables starting with an underscore are intermediate assets. They’re not stable, so please don’t rely on the data in them.

We hope these changes make it easier for a wider variety of users to use our data! Now that we’ve wrapped up this infrastructural work, we’ll shift our focus back to integrating new datasets like PHMSA and EIA 176.

If you want help getting started with our data, or have any datasets you’d like us to integrate, we’d love to talk: drop by our office hours and we’ll walk you through any questions you might have.
Categories
updates

OpenMod USA Takeaways

We had a great time attending the OpenMod USA conference at Stanford last month. Thanks to Open Energy Transition for organizing, and for inviting us to moderate a panel on open data! Thanks also to Greg Miller, Greg Schivley, Ted Nace, and our very own Christina Gosnell for speaking on our panel.

We got to meet a whole bunch of smart, friendly folks who are working on using their energy system modeling skills to facilitate the global energy transition. We learned a lot about how we can better support their work, including these high level takeaways:

  1. We’re still missing useful datasets! There wasn’t a strong front-runner for most-requested dataset, but we clearly heard a need for transmission, gas, and hourly demand, among others.
  2. Our users are interested in making their own technical systems more robust and easier to work with.

It’ll be a continuous process of improvement, of course, but we’ve started working on some projects as a result!

We do have to pick and choose which datasets to integrate first. Right now we’re focusing on natural gas data, integrating EIA 176 with the help of davidmudrauskas, and our own e-belfer is extracting transmission and distribution data from PHMSA.

One way to integrate more data more quickly is to mobilize our community to help integrate new data sources! That means we need to make contributing to PUDL much easier.

The first, most important phase of integrating a new dataset is the exploratory one. You can spend countless hours learning the specific quirks and pain points of the data. Because many of our users are already familiar with these datasets, we encourage “knowledge contributions” in the form of plain-language documentation or useful scripts that handle part of the data wrangling process. We’ve updated our contributing docs to highlight those cases, and have made a new repository to hold the teeming masses of dataset-specific knowledge.

We are also improving our Kaggle environment so that anyone can use PUDL without setting up a whole Python environment. This will make it easier for users to explore PUDL data, especially data that we have archived and/or extracted but not completely cleaned, validated, or connected. 

Apart from the dataset integrations and contribution improvements, we’re following up with folks from the conference to see how we can help them with software architecture, engineering, and infrastructure guidance – we’re looking forward to growing those relationships. If you are curious about how we can help you in this area, don’t hesitate to reach out at hello@catalyst.coop!

In closing, OpenMod was a great experience! We’re excited to build a community that can do amazing things with complete, connected, granular, and accessible energy data. We’re pursuing a bit of funding to support our community efforts, so keep your fingers crossed for us and stay tuned for more updates next year!

Categories
updates

Summer 2023 Goals

We’ve been working on our goal-setting process at Catalyst, and want to share our high-level goals for the summer – these take us through September 2023.

Publish all data products as SQL tables

In the past, we’ve published data products in two ways: a large portion of our data was published in SQLite/Parquet files; the rest, including many of our analysis outputs, were calculated directly in the PudlTabl Python class. You could interact with the SQLite and Parquet data any way you wanted. However, to access the latter, you’d need to install the latest version of PUDL and all its dependencies. Maintaining that environment and managing the dependencies was an unnecessary barrier to data analysis.

You may have noticed, from our nightly builds, that more and more of the outputs from PudlTabl are stored directly in pudl.sqlite. We’ve been working on this transition for a few months, since the Dagster migration, and finally have just a few data products remaining: the MCOE outputs (heat_rate_by_unit, heat_rate_by-generator, fuel_cost_by_generator, capacity_factor_by_generator, and mcoe) and the plant parts list (mega_generators, plant_parts_eia). Soon, you’ll be able to access all of our data without installing the PUDL Python package!

This also means PudlTabl will soon be deprecated, and the preferred way to access our data will be through conventional SQL and Parquet tooling such as Datasette, SQLAlchemy, or RSQLite.

Integrate new datasets into PUDL

We also plan to integrate some shiny new datasets, starting with PHMSA data. This contains operational data about methane gas gathering, transmission, and distribution in the US. After a stretch of infrastructure investment, we’re excited to focus on the “integrate new datasets” part of our partnership with Sloan! We’re doubly excited to expand into the methane gas aspect of US energy system data.

Integrate 2022 data for existing datasets

We’re working with RMI to integrate the 2022 data from our existing datasets, such as FERC forms 1/2/6/60/714 and EIA forms 860/860m/861/923. Each year, new data brings new challenges, but this quarter we plan to build automation tooling to help us detect issues as they arise and reduce the manual work required each year. This will be especially important as the annual data reconciliation requirements will increase when we integrate new datasets. This year, we’re especially interested to see how the FERC XBRL data has changed since its debut in 2021. 

Support RMI’s financial modeling efforts

We are also pleased to provide development and architectural support for RMI’s Optimus financial modeling tool. Optimus can show utilities how IRA incentives make cleaner portfolios better long-term investments, aid commercial partners in quantifying the distributional impact of their electrification plans, and support advocates by showing how ratemaking can evolve to minimize the burden of the transition on LMI customers. We’re helping RMI revamp the engineering side of their system to support faster, more confident development of the model.

Apply automated entity matching techniques

We’ve been working with CCAI on entity-matching problems in the energy data space. So far, we’ve been experimenting with using Splink to match EIA and FERC plant IDs. This summer,  we’re hoping to bring that process into PUDL and generalize it to other problems such as inter-year FERC to FERC plant ID matching.

Meet new people and organizations!

Of course, we’re also looking to connect with exciting new people! We’re looking for new contributors, grant funders that are interested in PUDL development and maintenance, and organizations that could benefit from our blend of energy policy domain knowledge and data engineering/data science expertise. If that sparks any connections in your mind, please drop us a line at hello@catalyst.coop.

Categories
updates

Open-Source Initiative Releases 24/7 Grid Emissions Data Built on PUDL

At Catalyst we’re always eager to see how our users deploy Public Utility Data Liberation (PUDL) data IRL. By “in real life” we mean in the worlds of public policy, energy system modeling, and clean energy advocacy. So we couldn’t be more excited to help introduce the energy data world to the Open Grid Emissions Initiative. Open Grid Emissions builds on top of PUDL to provide the most comprehensive, accurate, and granular public dataset of US electric greenhouse gas emissions.

This Singularity Energy initiative uses open source, well-documented, and validated methodologies to deliver hourly emissions estimates. These granular estimates can be used to improve GHG accounting, policymaking, energy attribute certificate markets, and academic research. The initiative grew out of an earlier research project proposed by UC Davis researcher Greg Miller and data scientists at Catalyst Cooperative that won the U.S. EPA’s EmPOWER Air Data Challenge. As an open-source research initiative, it will always be free and open.

The Open Grid Emissions Initiative uses the U.S. EPA’s eGRID annual emissions methodology as its foundation. The Initiative then integrates innovations from existing peer-reviewed research (such as these open-source tools from Stanford researchers) and novel methods improve data resolution and refine emission calculations. In particular, Open Grid Emissions fills gaps in the hourly continuous emissions monitoring (CEMS) data reported to EPA’s Clean Air Markets Division by assigning hourly profiles to small facilities that only provide month-level data to the EIA.

Linking the CEMS data to monthly EIA data also allows for estimates of emissions from individual generators within a larger facility. This can be particularly helpful for multi-fuel facilities with vastly different emissions profiles. Open Grid Emissions also applies the EPA’s eGRID methodologies for cleaning and processing annually-aggregated CEMS data to hourly data. which allows for the imputation of missing or incomplete data. Taken together, these innovations result in the most complete and granular inventory of power sector emissions available for the US facilities.

For more information on the Open Grid Emissions Initiative, check out this write up in Canary Media.

Categories
updates

Rescuing Historical FERC Data

UPDATE 2022-01-19: We have received word from FERC that access to the historical data discussed below will be restored this week. As it becomes available we will also archive it on Zenodo just in case. Thank you to everyone who reached out and helped bring this issue to FERC’s attention!

This week we discovered that decades worth of energy system data collected by the Federal Energy Regulatory Commission (FERC) had been removed from the agency’s website. They apparently have no plan to archive it or migrate it to another platform. We are attempting to obtain a bulk download of all this data so we can archive it alongside our other raw data sources on Zenodo.

This data records many financial, operational, and economic aspects of the US energy system. It is a unique and valuable resource for anyone trying to understand how public policy and market conditions have shaped our energy system over time. Simply deleting this data with no warning, no plan to archive it, or migrate it to another platform is completely unacceptable.

If you know someone within FERC who can help get us a copy of this data to archive publicly, please put us in touch: hello@catalyst.coop

Categories
updates

PUDL v0.5.0: 2020 and Beyond

It’s been almost a month since we pushed out our first actual quarterly software and data release: PUDL v0.5.0! The main impetus for this release was to get the final annual 2020 data integrated for the FERC and EIA datasets we process. We also pulled in the EIA 860 data for 2001-2003, which is only available as DBF files, rather than Excel spreadsheets. This means we’ve got coverage going back to 2001 for all of our data now! Twenty years! We don’t have 100% coverage of all of the data contained in those datasets yet, but we’re getting closer.

Beyond simply updating the data, we’ve also been making some significant changes to how our ETL pipeline works under the hood. This includes how we store metadata, how we generate the database schema, and what outputs we’re generating. The release notes contain more details on the code changes, so here I want to talk a little bit more about why, and where we are hopefully headed.

If you just want to download the new data release and start working with it, it’s up here on Zenodo. The same data for FERC 1 and EIA 860/923 can also be found in our Datasette instance at https://data.catalyst.coop

Categories
updates

New PUDL Software & Data Release: v0.4.0

In August we put out a new PUDL software and data release for the first time in 18 months. We had a lot of client work, and kept putting off doing the release, so a whole lot of changes accumulated. Some highlights, mostly based on the continuously updated release notes in our documentation:

New Data Coverage

  • EIA Form 860 added coverage for 2004-2008, as well as 2019.
  • EIA Form 860m has been integrated (through Nov 2020). Note that it only adds up-to-date information about generators (especially their operational status).
  • EIA Form 923 added the 2001-2008 data, as well as 2019.
  • EPA CEMS Hourly Emissions covering 2019-2020.
  • FERC Form 714 covering 2006-2019, but only the table of hourly electricity demand by planning area. This data is still in beta and the data hasn’t been integrated into the core SQLite database, but you can process it on the fly if you want to work with it in Pandas.
  • EIA Form 861 for 2001-2019. Similar to the FERC Form 714, this ETL runs on the fly and the outputs aren’t integrated into the database yet, but it’s available for experimental use.
  • US Census Demographic Profile 1 (DP1) for 2010. This is a separate SQLite database, generated from a US Census Geodatabase, which includes census tract, county, and state level demographic information, as well as spatial boundaries of those jurisdictions.
Categories
updates

Environmental Justice Data Liberation

We’ve come across a few allied projects looking at environmental justice data specifically, and thought it would be nice to share!

Environmental Enforcement Watch

In May, Christina and I gave a talk at CSV,Conf,v6 about things we’ve learned liberating US energy system data. We focused a lot on the challenge of making data accessible to advocates. The following talk was analogous, but focused on environmental justice data. The speaker was Kelsey Breseman (@ifoundtheme) from the Environmental Data and Governance Initiative (EDGI) and their project Environmental Enforcement Watch (EEW). EEW is trying to hold polluters accountable using federally reported data, by making that data more accessible to and understandable by the people who are affected. They’re scraping the data from the web and creating a database that folks can query using Google CoLab notebooks. At the same time they’re trying to get EPA the full underlying database accessible to the public.

You can watch her excellent talk here:

I was struck by how many parallels there were between our work. We’re both trying to mitigate the poor curation of government data, and make it more accessible way to the public. EDGI also seems very open and GitHub centered and is trying to operate as a horizontal organization. They support themselves through foundation grants and volunteer labor. Nobody works on EDGI full time. They have a fiscal sponsorship agreement through Earth Science Information Partners (ESIP).

If you’re interested in public data and environmental justice they seem like a great organization! Maybe we can collaborate at some point.

Categories
updates

Automated Data Wrangling

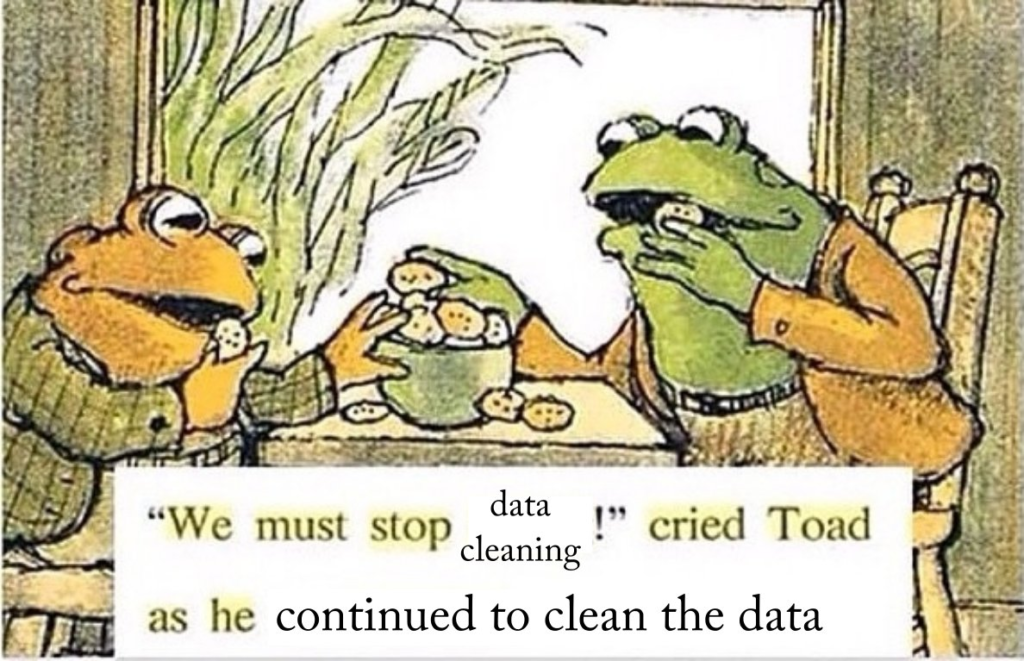
An illustration from the Frog and Toad children's books, where Frog and Toat are eating cookies. The caption has been altered to say "We must stop data cleaning!" cried Toad as he continued to clean the data.
Frog and Toad are Data Wranglers

We work with a lot of messy public data. In theory it’s already “structured” and published in machine readable forms like Microsoft Excel spreadsheets, poorly designed databases, and CSV files with no associated schema. In practice it ranges from almost unstructured to… almost structured. Someone working on one of our take-home questions for the data wrangler & analyst position recently noted of the FERC Form 1: “This database is not really a database – more like a bespoke digitization of a paper form that happened to be built using a database.” And I mean, yeah. Pretty much. The more messy datasets I look at, the more I’ve started to question Hadley Wickham’s famous Tolstoy quip about the uniqueness of messy data. There’s a taxonomy of different kinds of messes that go well beyond what you can easily fix with a few nifty dataframe manipulations. It seems like we should be able to develop higher level, more general tools for doing automated data wrangling. Given how much time highly skilled people pour into this kind of computational toil, it seems like it would be very worthwhile.

Like families, tidy datasets are all alike but every messy dataset is messy in its own way.

Hadley Wickham, paraphrasing Leo Tolstoy in Tidy Data
Categories
updates

Catalyst partners release energy transition resources

In the past two weeks, Catalyst partners Energy Innovation and the Rocky Mountain Institute have released two major resources based on open data to help stakeholders better understand the energy transition in the US electricity sector. We’re excited to say that Catalyst team members prepared data from Catalyst’s Public Utility Data Liberation project and provided analytical support for both resources.

Energy Innovation’s Coal Cost Crossover 2.0 provided an update to their 2018 report, which projected that by 2025 three quarters of the nation’s coal power plants would be uneconomic. The 2.0 shows that the economics of coal power in the US have deteriorated more rapidly than expected. The report finds that 80% of existing coal plants are either uneconomic or slated to retire before 2025. Economic viability is assessed by comparing coal plant operating costs with estimates of building new renewable facilities nearby, using the levelized cost of wind and solar energy estimates from the National Renewable Energy Laboratory’s Renewable Energy Deployment System (ReEDS) model. Coal operating costs are derived from fuel and operations/maintenance data from FERC and EIA, or from estimates from the National Energy Modeling System where FERC and EIA data was unavailable. 

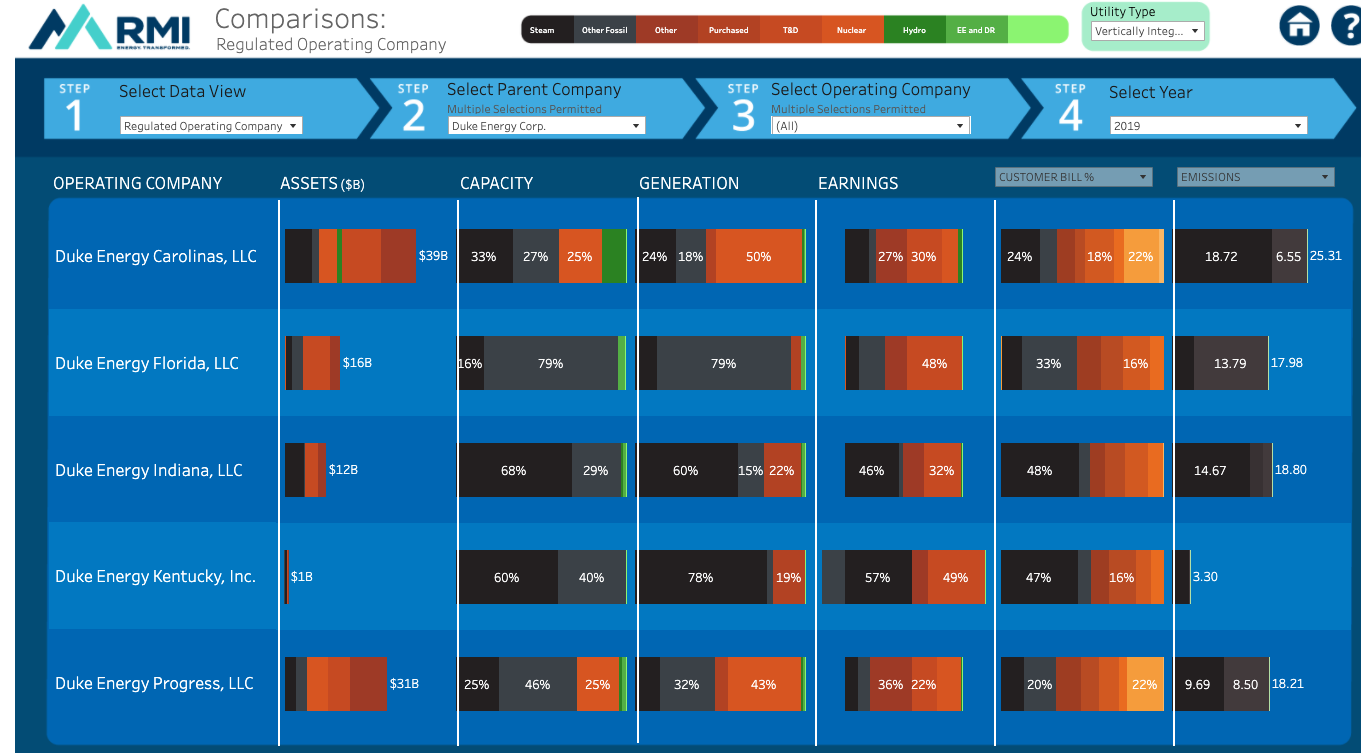
The Rocky Mountain Institute recently released the first version of their Utility Transition Hub, an interactive data portal that allows users to track, quantify, and understand how investments, operations, policies, and regulations shape outcomes in the electricity sector. Stakeholders can explore the energy transition in the power sector as a whole, group subsidiary utilities by their parent company, or make comparisons between utilities. Cleaned data from FERC and EIA underly Tableau visualizations which help users to evaluate historical performance on emissions reductions and investments in renewables, and to assess the alignment of resource planning and climate commitments with a 1.5 degree C trajectory.

Comparing attributes of Duke Energy Corporation's operating subsidiaries, segmented by plant type.
Comparing attributes of Duke Energy Corporation’s operating subsidiaries, segmented by plant type, on RMI’s Utility Transition Hub.