We recently found out that Kamran Tehranchi, one of two primary maintainers of the PyPSA-USA open source power system model, was working on adapting it to use open data that we publish through our Public Utility Data Liberation Project (PUDL), so we interviewed him over email to find out more about his experience making the switch.
Can you tell us a little bit about yourself? What problems are you working on? Where are you at?
Sure! I’m currently a PhD Student at Stanford University working in the Interdisciplinary Energy Systems (INES) Lab. By way of my research, I am also an energy system modeler and open-source software developer. My work focuses on electricity system planning, specifically on the impact of electricity transmission resolution within planning models. I primarily work with engineering-economic simulation and optimization models, mainly production cost simulations and capacity expansion models. I use these models to design and simulate future energy systems to understand the impacts of emerging technologies, policies, and climate-energy system interactions. One of the main projects I’ve been working on this past year is the PyPSA-USA planning model which in-part leverages PUDL to develop the electricity system data model.
We are excited to share that the Public Utility Data Liberation Project (PUDL) and Catalyst Cooperative have been awarded a Pathways to Open Source Ecosystems (POSE) Phase I grant by the National Science Foundation (NSF)! This grant will fund a slate of community building and infrastructure projects to expand the PUDL community and facilitate contributions.
We’ve spent time on community-building activities like developing relationships with open energy modelers, presenting at conferences, hosting office hours, and responding to questions on Github Discussions. We applied for the NSF POSE grant so that we can spend more time fostering the PUDL community and improving people’s experience working with public energy data.
Getting to know our community
Are you a researcher or analyst working with energy data or models? An environmental non-profit, clean energy advocate or data journalist working on the U.S. energy transition? A data engineer or open-source expert interested in contributing to the energy transition?
If so, we would love to talk to you! For the first step of our POSE grant, we’re conducting a series of half-hour interviews over the next month to better understand how people find, prepare, and work with energy data, the different contexts they’re working in, and what their biggest data pain points and challenges are. You can sign up using this link. Please spread the word and forward this link to anyone you think might be interested!
Our Focus Areas
With POSE funding, we’ll be working to get PUDL data into more hands and creating new opportunities to contribute back to the PUDL ecosystem. Here’s a glimpse into what’s in the works:
Exploring new front-end tools to make PUDL data easier to access: We’re busy prototyping an alternative to our existing UI tool. Stay tuned, we’ll be looking for users to give us feedback on our beta tool!
Creating new resources for PUDL users: We’ll be hosting a webinar aimed at nonprofits and developing new data access tutorials to make accessing our data easier than ever before.
Supporting PUDL’s contributors: We’ll be developing new resources and coordination practices for external contributors, and creating a contributor onboarding workshop.
Addressing technical barriers to contribution: Whether refactoring memory-intensive tests, or improving our data validation framework using Pandera, Pydantic, and Dagster asset checks, we’re excited to implement some long-awaited improvements to support more distributed development.
Coming to a town near you!: We’ll be traveling to academic conferences, university brown-bags, FOSS meetups and more in order to present on the PUDL project and connect with other clean energy advocates.
Developing organizational models and governance practices to sustain our growing ecosystem: In conversation with our downstream users, we’ll be developing strategies to keep PUDL free, accessible and maintained in the long-term.
We’ll be sharing updates on POSE-funded projects on our socials, blog and newsletter over the coming months. If you want to learn more about any of these projects, get in touch via [email protected] or drop by our office hours.
Catalyst is very excited to announce that we have hired Nancy Amandi as a technical writer for PUDL’s Google Season of Docs project (full proposal here). The project will run from June through October, during which time Nancy will work on improving our documentation to make it easier for PUDL users to navigate and find the data they need.
Currently, it’s difficult for new (and long-time) PUDL users and contributors to quickly jump in and start using PUDL because our documentation is extensive and spread out between multiple repositories and websites. We have a data dictionary page in our docs, a Datasette deployment for exploring the data, and a set of example notebooks hosted on Kaggle, but none do a particularly good job of shepherding users to the data they want. The goal of this project is to create a better, more nested, system of table/column documentation so users aren’t overwhelmed by PUDL and know where to find the latest versions of the tables that are most relevant to them!
If you’ve ever struggled to navigate the PUDL docs and have feedback, please send an email to [email protected], and we will incorporate suggestions into our plan for the project.
About Nancy
Nancy is a data engineer and technical writer living in Nigeria. She’s passionate about helping data-driven businesses write clear, concise documentation to convey complex technical concepts to a diverse range of audiences. In addition to her writing, Nancy has extensive experience in creating scalable data pipelines, exhaustive data mining, explanatory datasets, analytical models, and business reporting solutions with structured, semi-structured, and unstructured data. In 2023, Nancy and her team members won the Nigeria Energy Forum Tertiary Institutions Energy Pitch Challenge for their work on OneGrid Energies, a clean tech startup working towards closing the energy affordability gap in Nigeria.
Linking power plant financial data to energy system operational data with help from Climate Change AI
At the end of 2023, Catalyst wrapped up work funded by a Climate Change AI (CCAI) Innovation Grant using entity matching (record linkage) to connect the energy system financial data reported to the US Federal Energy Regulatory Commission (FERC) and physical energy system data reported to the US Energy Information Administration (EIA). While the data published in FERC Form 1 refers to the same utilities, power plants, and generators that are reported by EIA, these entities lack common IDs to link them. This connection between datasets is necessary to show that retiring certain fossil fuel power plants in favor of renewable energy sources is economically beneficial and technically feasible while still meeting the physical demands of today’s grid. Conducting entity matching to model this connection eliminates the extremely laborious process of sifting through these datasets and performing a manual connection. In collaboration with and support of RMI’s Utility Transition Hub, Catalyst created a small validation dataset of manually linked records, and thus know first hand the tedium of conducting this linkage manually.
Over the course of the grant period we developed the connection of FERC Form 1 plants to EIA data from a one-off module to an integrated analysis maintained and deployed with our nightly PUDL builds. Along the way, we updated our FERC-FERC plant connection (the plant_id_ferc1 column in out_ferc1__yearly_all_plants in the PUDL database), providing a unique plant ID to link FERC plants across all years of reporting. We believe our published output table of connections (out_pudl__yearly_assn_eia_ferc1_plant_parts in the PUDL database) is the only regularly updated, free and open-source connection between the FERC and EIA datasets.
We hope the result enables advocates working to decarbonize our electricity system to more easily bring defensible and data-driven analyses to state-level legislative and regulatory processes. Additionally, we hope that the published matching framework can serve as an open-source example of record linkage for energy datasets and be a model for attempting similar connections with other energy datasets.
Inputs
The data published in FERC Form 1 is messy; reported records correspond to an assortment of generator aggregations (e.g. prime mover, primary fuel source, technology type, plants, or generator units). To create an EIA input that could match the diversity of records reported in FERC Form 1, we created the EIA “plant parts table”. This table contains aggregations of all EIA “plant parts” corresponding to the various granularities appearing in the FERC data.
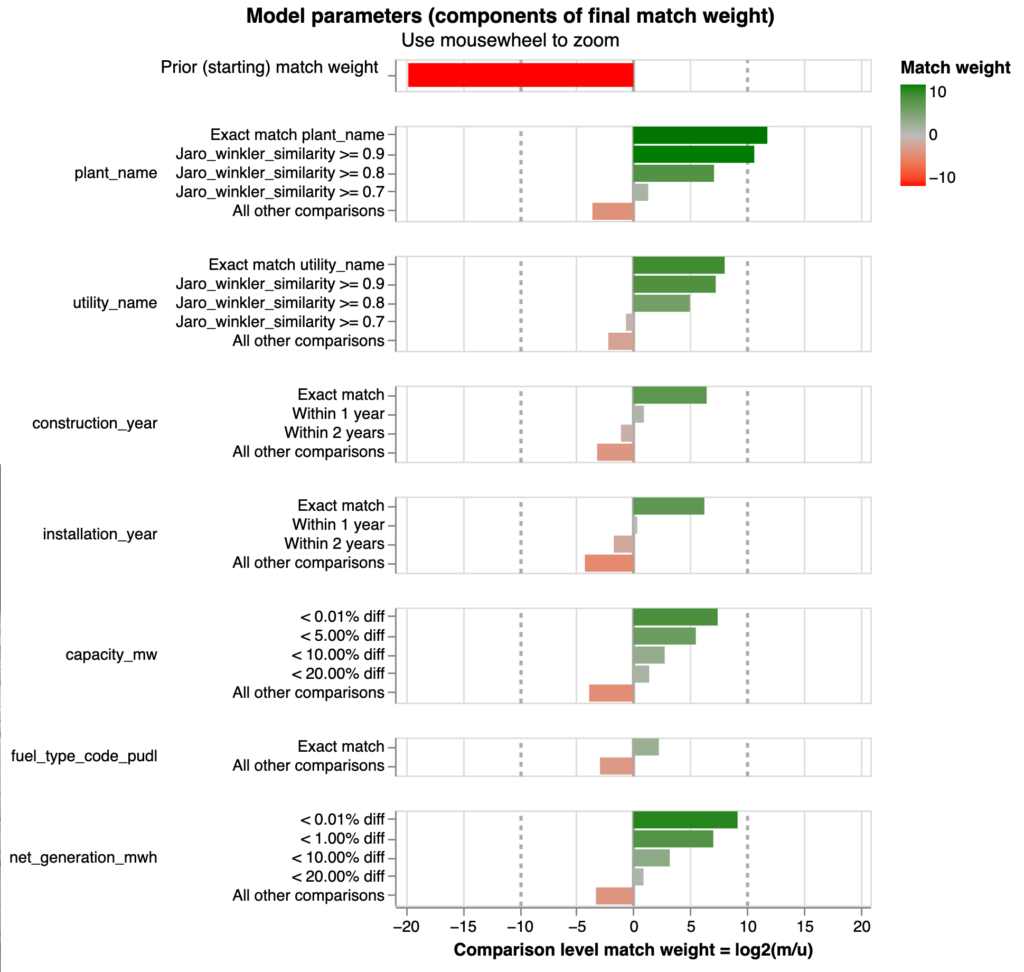
After experimenting with several machine learning packages, we decided to use the open-source Python package Splinkas it provided helpful transparency into the effects of changing model parameters and produced results better than our existing baseline. Splink is an entity matching and deduplication interface based on the Fellegi-Sunter algorithm for record linkage. Its main advantages are its speed working with data locally, its interface for users to define fuzzy matching logic between attributes in the input datasets, and its features for doing an unsupervised match (with no training data). Splink provides interactive charts of the model weights that make it easier for downstream users to provide feedback without advanced understanding of the underlying model mechanics.
Results
We used the manually matched dataset to evaluate the model results by a metric of precision and recall. Consider the set of FERC records in this manual validation dataset that the model predicted a matching EIA record for. Precision is the percentage of these matches that are correct. It represents the model’s accuracy when making a prediction. Now, consider all of the FERC records in the manual validation dataset. Recall is the percentage of these FERC records that the model predicted an EIA match for. It represents the model’s coverage of the FERC dataset. The table below displays the precision and recall of the Splink model alongside a baseline linear regression model that was previously integrated into PUDL. The “match probability threshold” is the threshold at which pairs with a lower probability of matching are labeled as a non-match. As the match threshold decreases, more record pairs are labeled as a match and the recall increases. However, precision decreases as the match threshold decreases because the match quality is lower and more FERC records are matched to an incorrect EIA record. Considering the needs of downstream users, we prioritized publishing match results with high precision and thus chose a match threshold of .9 for use in our deployed model.
Match Probability Threshold
Precision
Recall
.95
.944
.833
.9
.943
.843
.75
.940
.862
.5
.939
.875
.25
.938
.887
baseline
.90
.73
Challenges and Limitations
One of the initial challenges we encountered during the project was the high percentage of null values in the input datasets. This significantly impacted the quality of our entity matching results. Additionally, our manually compiled training/validation dataset was relatively small and inherently introduced some unknown biases within the small sample size. Recognizing the dynamic nature of data over time and the potential shifts in representation as more data is published, we additionally experimented with the unsupervised training features for the Splink model. Results were similar to those of the supervised model, and we anticipate using the unsupervised model in the event that the existing training data becomes too outdated or fails to represent evolving patterns in the data. This forward-looking approach ensures adaptability to new data trends and optimizes for scenarios not adequately represented in the initial training dataset.
What’s Next?
With the development of this framework for entity matching, Catalyst is capable of greater flexibility and efficiency in data-driven model development. In 2024, we are building on this framework using funding from the Mozilla Foundation to link Security Exchange Commission utility ownership data to EIA utility operational data. We hope to leverage these models to address analogous issues in natural gas data in the future.
Catalyst is making exciting progress in providing open data to electricity resource planning models like the GridPath RA Toolkit with support from GridLab. Our initial work on these inputs has revealed that there is a need for entity matching in almost all of the datasets under consideration. For example, the Western Electricity Coordinating Council’s Reliability Modeling Anchor Data Set (WECC ADS) has transmission node IDs, generator IDs, and utility IDs that do not match other data sets referring to the same entities. We are excited to utilize the resource efficiency, usability, and transparency of Splink in building entity matching models for these datasets.
Please reach out to us with questions about the modeling process or resulting connection table, and let us know how you are utilizing the FERC to EIA connection!
We’re going to use Mozilla’s support to link US Securities and Exchange Commission data about utility ownership to financial and operational information in the EIA forms 860/861/923, and through our previous record linkage work involving the EIA data, to FERC Form 1 respondents and the EPA’s continuous emissions monitoring system data.
The SEC Form 10-K is published through EDGAR as structured XBRL data, but the Exhibit 21 attachment that describes which companies own and are owned by other companies is unfortunately just a PDF blob that gets stapled to the XBRL, and so ownership relationships end up being unstructured, or at best, semi-structured data.
We’re going to apply document modeling tools that we’ve developed in some of our client work (to extract structured data from PUC and other regulatory filings) to extract the ownership information from Exhibit 21. This will hopefully include the ownership percentages when they are reported.
Then we’re going to use the generalized entity matching / record linkage tooling that we developed under our previous Climate Change AI Innovation Grant to connect the parent / subsidiary companies named in the SEC data to the financial and operational data reported by the same utility companies in FERC Form 1, as well as EIA and EPA data.
Why is this work important? Being able to make effective energy policy often requires an understanding of the political economy of utilities, and utilities are often composed of Russian doll-like nested holding companies. It can be hard to see where one utility ends and another begins. Understanding which entities share ownership and thus political and economic interests is key to being able to grapple with and influence them.
We’ll be learning from prior work on this problem done by the folks at CorpWatch, and we hope to make the outputs of our work easy to visualize and explore through the Oligrapher interface that LittleSis has developed.
If this work is interesting or useful to you, we’d love to hear more about your use case! You can track our work through this GitHub repository. Also, while we are explicitly focused on and familiar with utilities, the SEC’s Form 10-K covers all publicly traded companies, so we may be producing additional data outputs that aren’t useful to us but which could be useful to others. If that’s you, please let us know.
We’re excited to announce that you no longer have to install the PUDL Python library to access electric generation data linked across FERC and EIA such as capacity factor, heat rate, and fuel cost. These, and many others, are now available directly in the PUDL database, which you can download from Zenodo here. You can find more details on how to access the data here.
We were able to complete this large infrastructural overhaul with the help of generous funding from the Sloan foundation.
Now that you can use any tools you want to analyze the data, here are some ideas:
Use another language you like better: R, Rust, Ruby, or even other languages that don’t start with R (Julia?)
Use Kaggle to check out our data without installing any programming environments at all!
Hook up a BI tool to quickly generate low/no-code dashboards and visualizations!
Since we’re moving away from downstream use of the library, we are also deprecating the PudlTabl class. It will still work, for now, but it’s now just a shell around accessing the database tables and will be removed in a future release.
One further change we made during all of this was to rename a bunch of tables to make them a little easier to find and understand. Tables now have standardized prefixes, the nuances of which are explained in the docs. The short version is:
When in doubt, start with tables with the out_* prefix. These have been cleaned and connected into wide tables with lots of metadata and are designed to be easy to use for downstream analysis.
When you need to dig deeper, look at the core_* tables. These are the cleaned up building blocks of the out_* tables. You may need to join several core_* tables to get the metadata you want.
The tables starting with an underscore are intermediate assets. They’re not stable, so please don’t rely on the data in them.
We hope these changes make it easier for a wider variety of users to use our data! Now that we’ve wrapped up this infrastructural work, we’ll shift our focus back to integrating new datasets like PHMSA and EIA 176.
If you want help getting started with our data, or have any datasets you’d like us to integrate, we’d love to talk: drop by our office hours and we’ll walk you through any questions you might have.
We had a great time attending the OpenMod USA conference at Stanford last month. Thanks to Open Energy Transition for organizing, and for inviting us to moderate a panel on open data! Thanks also to Greg Miller, Greg Schivley, Ted Nace, and our very own Christina Gosnell for speaking on our panel.
We got to meet a whole bunch of smart, friendly folks who are working on using their energy system modeling skills to facilitate the global energy transition. We learned a lot about how we can better support their work, including these high level takeaways:
We’re still missing useful datasets! There wasn’t a strong front-runner for most-requested dataset, but we clearly heard a need for transmission, gas, and hourly demand, among others.
Our users are interested in making their own technical systems more robust and easier to work with.
It’ll be a continuous process of improvement, of course, but we’ve started working on some projects as a result!
One way to integrate more data more quickly is to mobilize our community to help integrate new data sources! That means we need to make contributing to PUDL much easier.
The first, most important phase of integrating a new dataset is the exploratory one. You can spend countless hours learning the specific quirks and pain points of the data. Because many of our users are already familiar with these datasets, we encourage “knowledge contributions” in the form of plain-language documentation or useful scripts that handle part of the data wrangling process. We’ve updated our contributing docs to highlight those cases, and have made a new repository to hold the teeming masses of dataset-specific knowledge.
We are also improving our Kaggle environment so that anyone can use PUDL without setting up a whole Python environment. This will make it easier for users to explore PUDL data, especially data that we have archived and/or extracted but not completely cleaned, validated, or connected.
Apart from the dataset integrations and contribution improvements, we’re following up with folks from the conference to see how we can help them with software architecture, engineering, and infrastructure guidance – we’re looking forward to growing those relationships. If you are curious about how we can help you in this area, don’t hesitate to reach out at [email protected]!
In closing, OpenMod was a great experience! We’re excited to build a community that can do amazing things with complete, connected, granular, and accessible energy data. We’re pursuing a bit of funding to support our community efforts, so keep your fingers crossed for us and stay tuned for more updates next year!
We’ve been working on our goal-setting process at Catalyst, and want to share our high-level goals for the summer – these take us through September 2023.
Publish all data products as SQL tables
In the past, we’ve published data products in two ways: a large portion of our data was published in SQLite/Parquet files; the rest, including many of our analysis outputs, were calculated directly in the PudlTabl Python class. You could interact with the SQLite and Parquet data any way you wanted. However, to access the latter, you’d need to install the latest version of PUDL and all its dependencies. Maintaining that environment and managing the dependencies was an unnecessary barrier to data analysis.
You may have noticed, from our nightly builds, that more and more of the outputs from PudlTabl are stored directly in pudl.sqlite. We’ve been working on this transition for a few months, since the Dagster migration, and finally have just a few data products remaining: the MCOE outputs (heat_rate_by_unit, heat_rate_by-generator, fuel_cost_by_generator, capacity_factor_by_generator, and mcoe) and the plant parts list (mega_generators, plant_parts_eia). Soon, you’ll be able to access all of our data without installing the PUDL Python package!
This also means PudlTabl will soon be deprecated, and the preferred way to access our data will be through conventional SQL and Parquet tooling such as Datasette, SQLAlchemy, or RSQLite.
Integrate new datasets into PUDL
We also plan to integrate some shiny new datasets, starting with PHMSA data. This contains operational data about methane gas gathering, transmission, and distribution in the US. After a stretch of infrastructure investment, we’re excited to focus on the “integrate new datasets” part of our partnership with Sloan! We’re doubly excited to expand into the methane gas aspect of US energy system data.
Integrate 2022 data for existing datasets
We’re working with RMI to integrate the 2022 data from our existing datasets, such as FERC forms 1/2/6/60/714 and EIA forms 860/860m/861/923. Each year, new data brings new challenges, but this quarter we plan to build automation tooling to help us detect issues as they arise and reduce the manual work required each year. This will be especially important as the annual data reconciliation requirements will increase when we integrate new datasets. This year, we’re especially interested to see how the FERC XBRL data has changed since its debut in 2021.
Support RMI’s financial modeling efforts
We are also pleased to provide development and architectural support for RMI’s Optimus financial modeling tool. Optimus can show utilities how IRA incentives make cleaner portfolios better long-term investments, aid commercial partners in quantifying the distributional impact of their electrification plans, and support advocates by showing how ratemaking can evolve to minimize the burden of the transition on LMI customers. We’re helping RMI revamp the engineering side of their system to support faster, more confident development of the model.
Apply automated entity matching techniques
We’ve been working with CCAI on entity-matching problems in the energy data space. So far, we’ve been experimenting with using Splink to match EIA and FERC plant IDs. This summer, we’re hoping to bring that process into PUDL and generalize it to other problems such as inter-year FERC to FERC plant ID matching.
Meet new people and organizations!
Of course, we’re also looking to connect with exciting new people! We’re looking for new contributors, grant funders that are interested in PUDL development and maintenance, and organizations that could benefit from our blend of energy policy domain knowledge and data engineering/data science expertise. If that sparks any connections in your mind, please drop us a line at [email protected].
At Catalyst we’re always eager to see how our users deploy Public Utility Data Liberation (PUDL) data IRL. By “in real life” we mean in the worlds of public policy, energy system modeling, and clean energy advocacy. So we couldn’t be more excited to help introduce the energy data world to the Open Grid Emissions Initiative. Open Grid Emissions builds on top of PUDL to provide the most comprehensive, accurate, and granular public dataset of US electric greenhouse gas emissions.
This Singularity Energy initiative uses open source, well-documented, and validated methodologies to deliver hourly emissions estimates. These granular estimates can be used to improve GHG accounting, policymaking, energy attribute certificate markets, and academic research. The initiative grew out of an earlier research project proposed by UC Davis researcher Greg Miller and data scientists at Catalyst Cooperative that won the U.S. EPA’s EmPOWER Air Data Challenge. As an open-source research initiative, it will always be free and open.
The Open Grid Emissions Initiative uses the U.S. EPA’s eGRID annual emissions methodology as its foundation. The Initiative then integrates innovations from existing peer-reviewed research (such as these open-source tools from Stanford researchers) and novel methods improve data resolution and refine emission calculations. In particular, Open Grid Emissions fills gaps in the hourly continuous emissions monitoring (CEMS) data reported to EPA’s Clean Air Markets Division by assigning hourly profiles to small facilities that only provide month-level data to the EIA.
Linking the CEMS data to monthly EIA data also allows for estimates of emissions from individual generators within a larger facility. This can be particularly helpful for multi-fuel facilities with vastly different emissions profiles. Open Grid Emissions also applies the EPA’s eGRID methodologies for cleaning and processing annually-aggregated CEMS data to hourly data. which allows for the imputation of missing or incomplete data. Taken together, these innovations result in the most complete and granular inventory of power sector emissions available for the US facilities.
For more information on the Open Grid Emissions Initiative, check out this write up in Canary Media.
UPDATE 2022-01-19:We have received word from FERC that access to the historical data discussed below will be restored this week. As it becomes available we will also archive it on Zenodo just in case. Thank you to everyone who reached out and helped bring this issue to FERC’s attention!
This week we discovered that decades worth of energy system data collected by the Federal Energy Regulatory Commission (FERC) had been removed from the agency’s website. They apparently have no plan to archive it or migrate it to another platform. We are attempting to obtain a bulk download of all this data so we can archive it alongside our other raw data sources on Zenodo.
This data records many financial, operational, and economic aspects of the US energy system. It is a unique and valuable resource for anyone trying to understand how public policy and market conditions have shaped our energy system over time. Simply deleting this data with no warning, no plan to archive it, or migrate it to another platform is completely unacceptable.
If you know someone within FERC who can help get us a copy of this data to archive publicly, please put us in touch: [email protected]