Categories
updates

Open-Source Initiative Releases 24/7 Grid Emissions Data Built on PUDL

At Catalyst we’re always eager to see how our users deploy Public Utility Data Liberation (PUDL) data IRL. By “in real life” we mean in the worlds of public policy, energy system modeling, and clean energy advocacy. So we couldn’t be more excited to help introduce the energy data world to the Open Grid Emissions Initiative. Open Grid Emissions builds on top of PUDL to provide the most comprehensive, accurate, and granular public dataset of US electric greenhouse gas emissions.

This Singularity Energy initiative uses open source, well-documented, and validated methodologies to deliver hourly emissions estimates. These granular estimates can be used to improve GHG accounting, policymaking, energy attribute certificate markets, and academic research. The initiative grew out of an earlier research project proposed by UC Davis researcher Greg Miller and data scientists at Catalyst Cooperative that won the U.S. EPA’s EmPOWER Air Data Challenge. As an open-source research initiative, it will always be free and open.

The Open Grid Emissions Initiative uses the U.S. EPA’s eGRID annual emissions methodology as its foundation. The Initiative then integrates innovations from existing peer-reviewed research (such as these open-source tools from Stanford researchers) and novel methods improve data resolution and refine emission calculations. In particular, Open Grid Emissions fills gaps in the hourly continuous emissions monitoring (CEMS) data reported to EPA’s Clean Air Markets Division by assigning hourly profiles to small facilities that only provide month-level data to the EIA.

Linking the CEMS data to monthly EIA data also allows for estimates of emissions from individual generators within a larger facility. This can be particularly helpful for multi-fuel facilities with vastly different emissions profiles. Open Grid Emissions also applies the EPA’s eGRID methodologies for cleaning and processing annually-aggregated CEMS data to hourly data. which allows for the imputation of missing or incomplete data. Taken together, these innovations result in the most complete and granular inventory of power sector emissions available for the US facilities.

For more information on the Open Grid Emissions Initiative, check out this write up in Canary Media.
Categories
updates

Catalyst partners release energy transition resources

In the past two weeks, Catalyst partners Energy Innovation and the Rocky Mountain Institute have released two major resources based on open data to help stakeholders better understand the energy transition in the US electricity sector. We’re excited to say that Catalyst team members prepared data from Catalyst’s Public Utility Data Liberation project and provided analytical support for both resources.

Energy Innovation’s Coal Cost Crossover 2.0 provided an update to their 2018 report, which projected that by 2025 three quarters of the nation’s coal power plants would be uneconomic. The 2.0 shows that the economics of coal power in the US have deteriorated more rapidly than expected. The report finds that 80% of existing coal plants are either uneconomic or slated to retire before 2025. Economic viability is assessed by comparing coal plant operating costs with estimates of building new renewable facilities nearby, using the levelized cost of wind and solar energy estimates from the National Renewable Energy Laboratory’s Renewable Energy Deployment System (ReEDS) model. Coal operating costs are derived from fuel and operations/maintenance data from FERC and EIA, or from estimates from the National Energy Modeling System where FERC and EIA data was unavailable. 

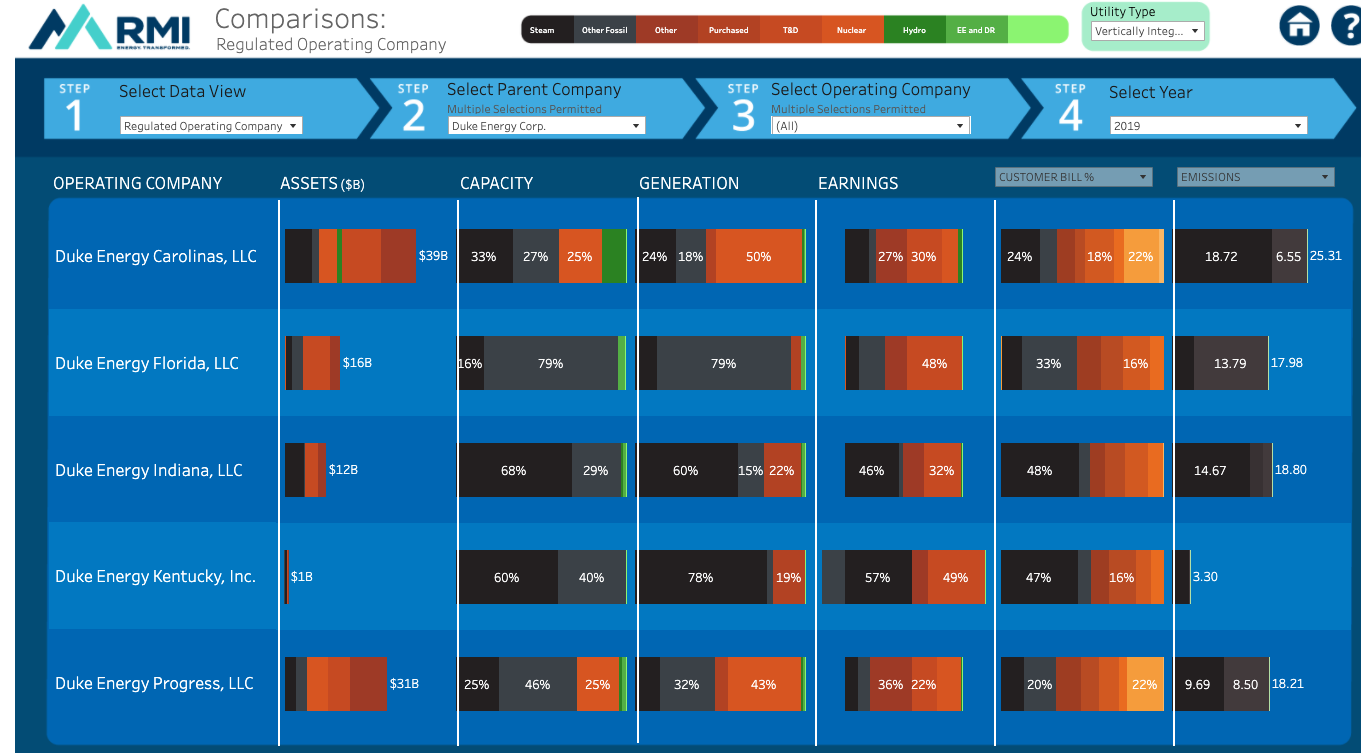
The Rocky Mountain Institute recently released the first version of their Utility Transition Hub, an interactive data portal that allows users to track, quantify, and understand how investments, operations, policies, and regulations shape outcomes in the electricity sector. Stakeholders can explore the energy transition in the power sector as a whole, group subsidiary utilities by their parent company, or make comparisons between utilities. Cleaned data from FERC and EIA underly Tableau visualizations which help users to evaluate historical performance on emissions reductions and investments in renewables, and to assess the alignment of resource planning and climate commitments with a 1.5 degree C trajectory.

Comparing attributes of Duke Energy Corporation's operating subsidiaries, segmented by plant type.
Comparing attributes of Duke Energy Corporation’s operating subsidiaries, segmented by plant type, on RMI’s Utility Transition Hub.