In the past two weeks, Catalyst partners Energy Innovation and the Rocky Mountain Institute have released two major resources based on open data to help stakeholders better understand the energy transition in the US electricity sector. We’re excited to say that Catalyst team members prepared data from Catalyst’s Public Utility Data Liberation project and provided analytical support for both resources.
Energy Innovation’s Coal Cost Crossover 2.0 provided an update to their 2018 report, which projected that by 2025 three quarters of the nation’s coal power plants would be uneconomic. The 2.0 shows that the economics of coal power in the US have deteriorated more rapidly than expected. The report finds that 80% of existing coal plants are either uneconomic or slated to retire before 2025. Economic viability is assessed by comparing coal plant operating costs with estimates of building new renewable facilities nearby, using the levelized cost of wind and solar energy estimates from the National Renewable Energy Laboratory’s Renewable Energy Deployment System (ReEDS) model. Coal operating costs are derived from fuel and operations/maintenance data from FERC and EIA, or from estimates from the National Energy Modeling System where FERC and EIA data was unavailable.
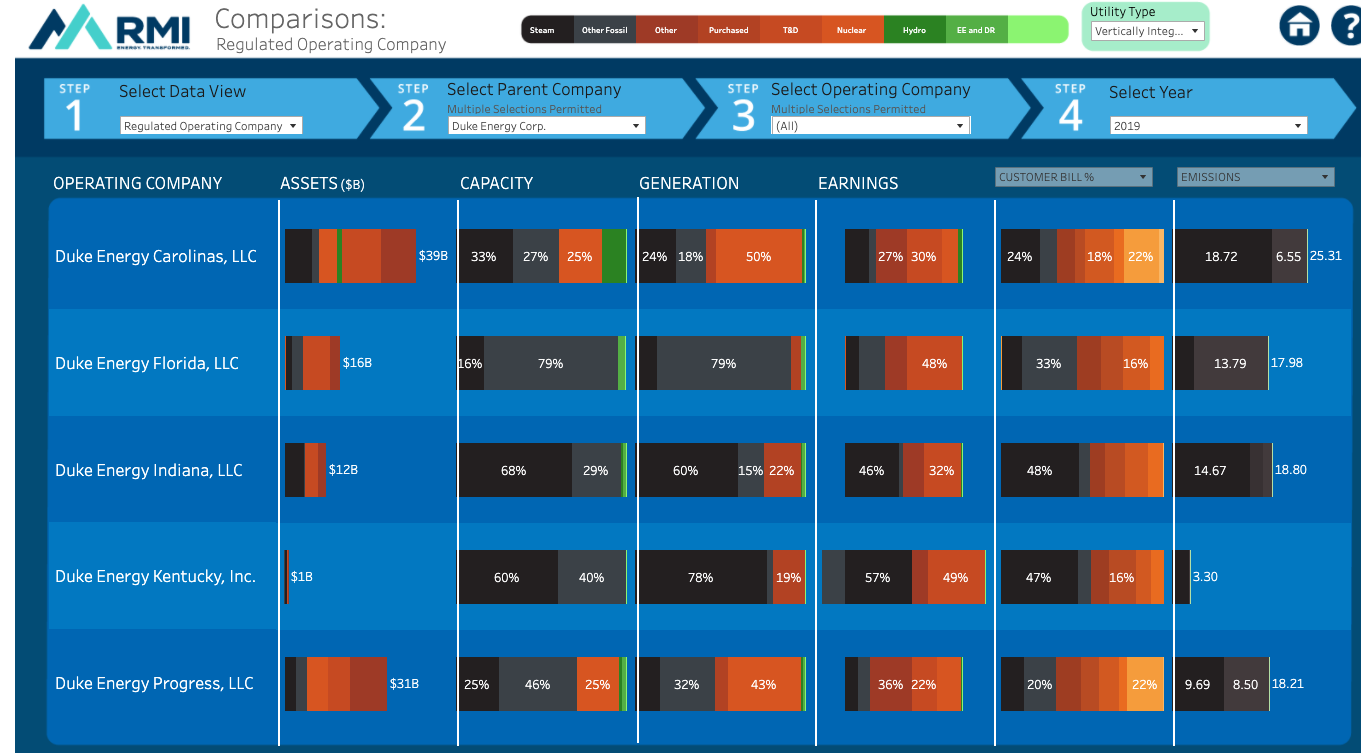
The Rocky Mountain Institute recently released the first version of their Utility Transition Hub, an interactive data portal that allows users to track, quantify, and understand how investments, operations, policies, and regulations shape outcomes in the electricity sector. Stakeholders can explore the energy transition in the power sector as a whole, group subsidiary utilities by their parent company, or make comparisons between utilities. Cleaned data from FERC and EIA underly Tableau visualizations which help users to evaluate historical performance on emissions reductions and investments in renewables, and to assess the alignment of resource planning and climate commitments with a 1.5 degree C trajectory.
